Calculate reading age
Readability & Reading Ages
Measuring the reading age of books and other reading matter.
Readability
This article outlines the subject of readability, and its relevance to school books.The 4 main sections of the article are:
- 1. The effect of interest and motivation.
- 2. Legibility, including type, layout and reading conditions.
- 3. Sentence structure, including readability formulae.
- 4. Reading ages for school textbooks, especially in science.
Introduction
When writing a textbook, a work-sheet or an examination paper, an author is intent on transmitting information to the reader. How well the author succeeds will depend on the readability of the text.
Readability is concerned with the problem of matching between reader and text. An accomplished reader is likely to be bored by simple repetitive texts.
A poor reader will soon become discouraged by texts which s/he finds too difficult to read fluently.
This is likely to happen when the text is :
- poorly printed,
- contains complex sentence structures,
- long words or
- too much material containing entirely new ideas.
The term readability refers to all the factors that affect success in reading and understanding a text.
These factors include:
- The interest and motivation of the reader.
- The legibility of the print (and of any illustrations).
- The complexity of words and sentences in relation to the reading ability of the reader.
These factors are discussed in turn, followed by the results of research into school science textbooks.
1. Interest and motivation
This aspect of readability is probably the most important, but unfortunately it is also the least tractable. A young electronics enthusiast may read and persevere with a complex electronics magazine, but quickly abandon the simplest history book.
This internal motivation is very powerful, but not easily modified by a teacher.There are other, external, factors which affect motivation and which can be adjusted to advantage. These include approval by the teacher, the use of merit marks, and success in tests and other tasks. ‘Nothing succeeds like success.’
Generally, motivation for reading school books is likely to be low. Indeed, a textbook has been defined as ‘a book that no-one would read unless they had to’.
In practice, this means that the prose in a school book usually should be much simpler than the readers are capable of reading.
This is particularly necessary when pupils are given instructions to perform a specific task — not only may the motivation be low, but the learning experience is likely to be spoilt unless the instructions are followed accurately.
2. Legibility of print
You are probably a fluent reader, reading at a rate of 250-300 words per minute, your eyes moving in a series of rapid jerks and pausing 8-10 times along the length of a typical line. These pauses consume about 90 per cent of reading time, each pause lasting for about 0.2 second. When there is difficulty in reading the text, your eyes are likely to make a backward movement, a ‘regression’. Reading then becomes less efficient in terms of speed, but more efficient in terms of comprehension.
The factors affecting speed and comprehension have been extensively researched.
However, due to the large number of variables, the conclusions are sometimes ambiguous. Some of the conclusions are summarized here, but more information can be found in the excellent monographs by Gilliland [1] and Watts and Nisbet [2].
(a) The type
More than a hundred type faces are in use in the UK, some much more legible than the others. Lower case print is preferred by most readers, and is read about 10 per cent faster than words in CAPITAL letters.
However, for single letters (eg. labels on diagrams), capital letters are more easily differentiated.
There seems to be no significant difference in legibility between serif and sans-serif type faces, whether on paper or on VDU screens [3].
Some designers prefer sans-serif for sub-heads and serif for the body text.
A fluent reader relies upon the upper coastline of the print for most of his information. In addition, the right-hand sides of letters give more information than the left.
Where emphasis is required, bold type is read more quickly than italics or CAPITALS.
(b) The layout
There are 4 inter-related factors here:
— the size of type,
— the length of line,
— the spacing between the lines (the ‘leading’) and,
— the weight of print.
If the size or type or length of line is changed, then the leading should be altered to maintain efficient eye movements.
10 point, 11 point and 12 point type seem to be the best sizes for fluent readers.
At the normal reading distance of 35 cm, 10 point type brings 4 letters within the foveal area and 20 letters within a 5 degree field of view.
Most word-processors set the leading at 120 per cent. ie. for a 10 point type face, the leading is 12 point. (72 points = 1 inch; 12 point = 4.2 mm)
Lines which are too short or too long cause inefficient eye movements. When considering the speed of reading, researchers have recommended line lengths in the range 6 – 9 cm (depending on the size of type and leading). The width of a VDU screen is often about 25 cm and an A4 worksheet may have lines of 18 cm.
Tinker [4] advocates a series of safety zones within which type size, line length and leading may be varied without loss of legibility. Some school books appear to lie outside these safety zones. However, the correlation between speed of reading and comprehension of information seems to be poor. In one study [5], a text in 18 point type set in 10 cm line length on a 21 point leading was ranked fourteenth in speed, but second in comprehension scores.
Overall, line lengths of 7 – 12 average words seem to be optimum.
Unjustified lines (ie. where the right-hand edge of the text is not straight) are better, because they help the reader’s eye to scan the lines more accurately.
White-space (between paragraphs), and sub-heads, help for the same reason.
(c) The reading conditions
Serious effects on legibility arise when vibration occurs with a hand-held book and when the line of vision is not at right-angles to the plane of the page. Books with thick spines may cause difficulty due to the curvature of the page, particularly where the inner (gutter) margin is narrow. Strong illumination may help here, by causing the pupil of the eye to contract, reducing spherical aberration and giving a greater depth of focus.
The brightness ratio between a book and the surrounding table surface should be 1:1 ideally, but a value of 3:1 is acceptable. Beyond 5:1 there is some impairment. Light-meter readings on a brown laboratory table indicate 30:1.
The size of margin does not seem to affect the speed of reading, but may cause increased eye fatigue if it is too narrow.
Matt paper causes less eye fatigue than glossy paper. The paper should be thick enough to prevent print on the reverse side showing through.
Black type on white paper (or a white screen) is more legible than any other colour combination. Blue, red and green on white are often acceptable. The worst combination is black type on a purple background.
3. Sentence structure
The third factor affecting readability is concerned with the words and sentences chosen by an author. This factor is the most easily quantifiable, and the rest of this article is concerned with this aspect of readability.
Consider two examples:
This short sentence needs a reading age of less than nine years.
This longer sentence, which contains an adjectival clause and polysyllabic words, has a reading age of more than sixteen years.
We use the term ‘reading age’ to indicate the chronological age of a reader who could just understand the text. The term is also useful when applied to the text itself: a text with a reading age of 14 years is one that could be read and just understood by a 14-year-old pupil having average reading ability.
The statistical distribution of reading ability in a population of a given age is ‘roughly normal’, according to the Bullock Report [6].
The expectation is that the range of reading achievement is likely to be two-thirds of the median chronological age of the group. ie. in a mixed-ability class of 12-year-olds, the reading ages would vary from 8 to 16.
In a science ‘set’, selected on the basis of ability in science, the range of reading ability can still be large.
In considering the suitability of a book or a work sheet for a class, it is desirable to determine the reading age of the text, to see how well it matches the reading ages of your pupils. The rest of this article looks at ways of doing this.
Methods of assessing Reading Age
Subjective assessment has been shown to be inaccurate, with teachers (perhaps because of their reading competence and familiarity with the subject) usually under-estimating the difficulty of the text (by up to 8 years).
There are four main methods of objective assessment:
A. Question and answer technique
Pupils of different ages are given the text to read. They are then questioned to gauge the level of comprehension and hence determine the reading age. This is usually unrealistic for practising teachers.
B. Sentence completion (the ‘cloze’ technique)
Sentences are taken from the text and every nth word is deleted. Often, n=5. These sentence completion exercises are then given to the pupils to test comprehension and gauge the reading age. Graham [7] and Mobley [8] have given details of how cloze tests can be applied to science texts. This method is also time-consuming.
C. Comparison of text with a standard word list
The percentage of words not included in the Dale word list is determined and the reading age calculated from this. Well-known examples are the Dale-Chall [9] and Spache [10] tests. Again, this method is tedious.
D. Calculations involving the sentence length and number of syllables
Objective measures of readability are now widely used. They are formulae (or graphs) which are based on an enormous amount of research evidence.
A readability formula predicts the reading level of the text. This is expressed as a chronological age and is accurate to about ± one year.
The reading level (reading age) predicted indicates that an average reader of that age could just cope with the text (but see the comments in point 3 of the final summary).
Harrison [11] and Klare [12] point out that there are well over 200 such tests !
Six of the most widely recognized tests are given in more detail below.
Some of the tests were used to find the reading ages of current UK textbooks, and these values are given in a table of science textbooks.
These tests are concerned simply with the length of sentences and the number of syllables. They do not take into account the order of words in a sentence, although some interesting work by Yngve [13] shows a method of calculating the complexity of the structure of a sentence.
Much of the work on reading ages has been done in America. The formulae give a numerical value which is the American grade level. Following normal practice, these grade levels are converted to reading ages by adding a value of 5.
When counting syllables for these tests, it helps to say the words aloud.
Some examples of syllable count are: another (3), area (3), passed (1), surface (2), surfaces (3), particle (3), enable (3).
When counting numbers, symbols, initials, etc, count one syllable for each number or letter. For example: 1998 = 4 syllables (1-9-9-8), 4.2 = 3 syllables (4-point-2), h3O = 3 syllables (H-2-O), USA = 3 syllables (U-S-A), Fig. 2 = 2 syllables (Fig-two).
But for abbreviations (cm, mm, km, kg, eg, ie), the usual rule is to count each as just one syllable.
Since headings and sub-headings are usually not sentences, they are best ignored. It is not known how to deal with a formula or a numerical calculation, so for the results below they were just ignored (but they probably increase the reading age).
Skip to the Results section or the Comments section below, if you don’t wish to see the details of each test.
1. Gunning ‘FOG’ Readability Test [14]
Select samples of 100 words, normally three such samples.
(i) Calculate L, the average sentence length (number of words ÷ number of sentences). Estimate the number of sentences to the nearest tenth, where necessary.
(ii) In each sample, count the number of words with 3 or more syllables.
Find N, the average number of these words per sample.
Then the grade level needed to understand the material = (L + N) × 0.4
So the Reading Age = [ (L + N) × 0.4 ] + 5 years.
This ‘FOG’ measure is suitable for secondary and older primary age groups.
2. Fry Readability Graph [15]
Select samples of 100 words.
(i) Find y, the average number of sentences per 100-word passage (calculating to the nearest tenth).
(ii) Find x, the average number of syllables per 100-word sample.
Then use the Fry graph (below) to determine the reading age, in years.
This test is suitable for all ages, from infant to upper secondary.
The curve represents normal texts. Points below the curve imply longer than average sentence lengths. Points above the curve represent text with a more difficult vocabulary (as in school science texts).
3. Flesch-Kincaid Formula
This is a US Government Department of Defense standard test [16].
(i) Calculate L, the average sentence length (number of words ÷ number of sentences). Estimate the number of sentences to the nearest tenth, where necessary.
(ii) Calculate N, the average number of syllables per word (number of syllables ÷ number of words).
Then grade level = ( L × 0.39 ) + ( N × 11.8 ) – 15.59
So Reading Age = ( L × 0.39 ) + ( N × 11.8 ) – 10.59 years.
4. Powers-Sumner-Kearl Formula [17]
This is the only one of the formulae suitable for primary age books.
Select samples of 100 words.
(i) Calculate L, the average sentence length (number of words ÷ number of sentences). Estimate the number of sentences to the nearest tenth, where necessary.
(ii) Count N, the number of syllables per 100 words.
Then grade level = ( L × 0.0778 ) + ( N × 0.0455 ) – 2.2029
So Reading Age = ( L × 0.0778 ) + ( N × 0.0455 ) + 2.7971 years.
This test is NOT suitable for secondary age books, and is most suitable for material in the 7 – 10 age range.
5. McLaughlin ‘SMOG’ Formula [18]
Select samples of 30 consecutive sentences.
In each sample, count the number of words with 3 or more syllables.
Find the average number, N.
Then grade level = (square root of N) + 3.
Reading Age = (square root of N) + 8 years.
This test tends to give higher values than the other formulae, because Mclaughlin intended it to predict the level necessary for 100% comprehension of the text (whatever that means), whereas other tests were validated against lower comprehension levels (see also the final comments, below).
6. FORCAST Formula [19]
This was devised for assessing US army technical manuals.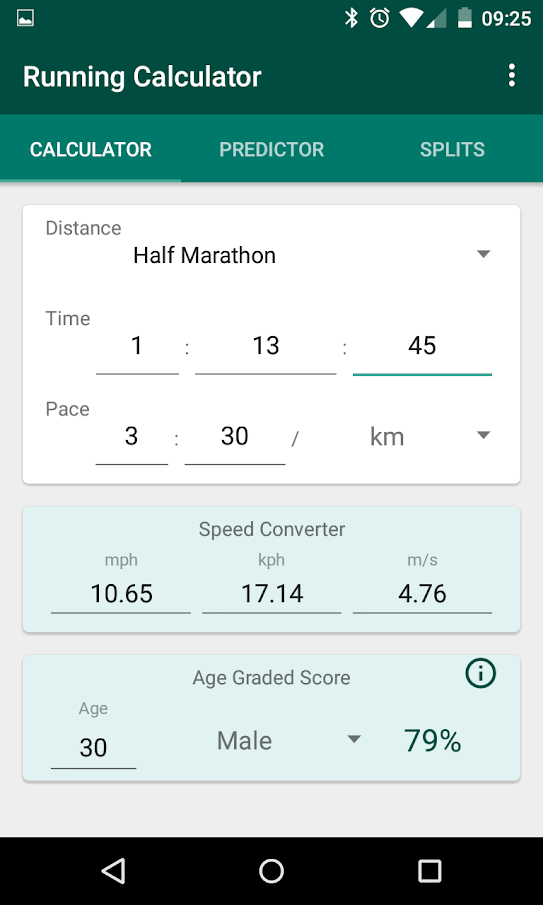
It is NOT suitable for primary age materials.
Because it is the only formula that does not need whole sentences, it is suitable for assessing notes and multiple-choice questions.
Select samples of 150 words. Count N, the number of single-syllable words.
Then grade level = 20 – ( N ÷ 10 )
Reading age = 25 – ( N ÷ 10 ) years.
If you use samples of only 100 words, reading age = 25 – ( N ÷ 6.67 ) years.
This formula was validated at only a 35% score on comprehension tests.
Other tests you may come across include: Flesch Reading Ease, Bormuth, and Coleman-Liau.
Results of applying the tests
General literature
In an attempt to calibrate some fixed points on the scale of readability, the averages of four tests (Fry, Gunning, Flesch-Kincaid, Forcast) were found for some items of general literature.
The results are:
| Reading Age (in years) | |
| Financial Times Times Educational Supplement This article ‘A Tale of Two Cities’ (Dickens) ‘To Kill a Mocking Bird’ (Lee) ‘Lord of the Flies’ (Golding) ‘Kes: A Kestrel for a Knave’ (Hines) | 17½ 17 16 13 11½ 11 10½ |
It is surprising that ‘Lord of the Flies’ and ‘Kes’, often used as set books for GCSE English examinations in the UK, should have readings ages as low as 11 years or less.
Physics Textbooks
In order to allow a reasonable comparison of the reading ages needed for the various physics textbooks that are available, four of the tests were applied to passages on the same eight topics.
The 4 tests were: Fry, Gunning, Flesch-Kincaid, and Forcast.
The topics that were chosen were eight that are in the UK National Curriculum and were expected to be found in any recent physics text.
These topics were all among the less-mathematical sections of work, because it was not known how to find the reading ages of numerical sections.
The eight sections were of work that is commonly taught in Years 10 and 11 of UK secondary schools (pupils’ ages 14 – 16):
Introductions to: (i) electric circuits; (ii) electromagnetic induction; (iii) Hooke’s law; (iv) refraction of light; (v) sound; (vi) Solar System; (vii) thermal conduction; (viii) alpha, beta, gamma rays.
Where a topic appeared more than once in a book, the passage used was the one that appeared earliest. ie. the introduction to the topic (at this level).
The four tests were applied to each of the eight sections for each text. ie. 32 tests per text.
The results are shown in the table.
The results for some Key Stage 3 Science texts, and GCSE Chemistry and Biology books are also shown.
The tables also show two Human Interest Scores for each book.
The table at www.timetabler.com is updated from time to time.
Some comments:1. Although the correlation between the four tests is high, when they are applied to a passage they usually give different results, the variation depending on the author’s style. The quoted results are the averages of the four tests.
2. When the tests were applied to the Physics books shown in the table, all the algebraic formulae and numerical calculations in the texts were ignored. In practice, the pupils are likely to stumble over these mathematical parts.
This fact, coupled with the choice of introductions to topics, suggests that the values shown in the tables are likely to be minimum values.
3. The reading level predicted by a readability test is the ‘break-off’ point for a reader of that reading age. ie. a reading level measured as 14 years predicts that an average 14-year-old would beat the limit of his/her reading comprehension ability with that book !
This is because most readability formulae are based on a 50 per cent correct answer score in a comprehension test.
So if a book has reading level of 14 years, an average 14-year-old pupil would score only 50 per cent on a test of comprehension of that text !
. . . and 50 per cent is a long way from full comprehension !
4. The intended level of a book, as stated in its introduction or the publisher’s catalogue is often a poor guide to the reading age need to study the text. Publishers are fond of the phrase ‘has a controlled reading age’ but this is virtually meaningless in practice.
5. In all discussions of readability tests it should be remembered that they are designed ‘for rating, not for writing’. ie. they are useful for analysing a text after it has been written. Trying to write to a formula tends to produce an uncomfortable staccato style.
6. Readability formulae cannot be the sole judge of the suitability of a text. Other factors need to be considered : for example, the size of type and length of line, sentence structure, the number of words per page, the use of colour, the use of diagrams, the page layout and whether confusing cross-references such as ‘see Fig. 39.27’ are required, the number of concepts per paragraph, the use of white-space between paragraphs, whether the text is ‘interactive’, the human interest score, etc.
The tables on the web-site also show two Human Interest Scores for each book.
7. Readability formulae do not distinguish all the subtleties of the authors’ styles.
For example, consider the following sentences:
The cat sat on your mat. The cat sat on the mat. On the mat the cat sat. Sat, on the mat: the cat. | The cat on the mat sat. On the mat sat the cat. Sat: the cat on the mat. Sat the cat on the mat? |
Readability formulae will give the same value to each of these sentences even though the first example is probably the most readable. (It has a personal touch and a clear sequence of subject-verb-object which names the topic and then describes it.)
However readability formulae do distinguish very clearly between crisp and extended styles of writing.
They will easily distinguish between:
‘The cat sat on the mat’ and ‘The feline reclined on the axminster’.
Some Physics texts have sentences of over fifty words with one or more subordinate clauses and two or more new concepts.
In such cases it is very doubtful if many pupils, when eventually reaching the full stop, can remember what the beginning of the sentence was about, still less extract the essential meaning from it.
8. Finally, consider a situation that must occur frequently in our schools.
A 14-year-old pupil studies ‘Lord of the Flies’ (reading age just 11 years) in an English lesson and then moves, after the lesson bell, to a Science lesson where his textbook requires a reading age of 15 or more.
There are three reasons why this situation requires an excessively large adjustment by the pupil.
First, the texts require a jump in reading age of four years (or perhaps even more, because of the numerical parts of the science texts). This makes it unnecessarily difficult for the student to get past the English in order to get to grips with the Science.
Pupils prefer to read below their reading level, and research by Klare [20] shows that they retain more in these circumstances. For a pupil to read independently (without help, but with comprehension), the reading level of the text should be two years below the pupil’s reading level.
Klare also found that if there is little motivation, differences in readability affect the student’s comprehension even more strongly.
Second, the pupil’s motivation may be adversely affected by the subject matter. In English the pupil is likely to be entertained and carried along by the story, but in Science s/he will be required to exert her/himself to complete specific tasks and calculations.
Most people prefer novels, rather than science texts, when reading for pleasure.
Third, the situation may be worse still, because of the way in which texts are used in these subjects. Harrison and Gardner [21] distinguish between supported and unsupported texts.
In subjects like English, teachers tend to support the text by using it in the classroom, often reading it aloud and using it as the basis for discussion. The teacher is present and actively explaining the text, or is at least immediately available to answer any questions.
Science texts, by comparison, are used infrequently in class (except for setting work when the teacher is absent). They are used mostly as a basis for homework, unsupported by the presence of the teacher.
Harrison and Gardner show that the reading ages of science texts ought to be about two years less than those of supported texts.
Clearly, this is not the case. Indeed, I wonder just what does happen when we say to a class, ‘Read these pages for homework’.
Keith Johnson
You can download this article as a .pdf file for Adobe Acrobat Reader, so it can be viewed as pages, as well as printed out more neatly.
References
1. Gilliland, J., Readability (University of London Press, 1972).
2. Watts, L. and J. Nisbet, Legibility in Children’s Books (NFER, 1974)
3. https:// www.acm.org/sigchi/chi95/proceedings/intpost/tst_bdy.htm
4. Tinker, M. A., Legibility of Print (Iowa State University Press, 1963)
5. Buckingham, B. R., New Data on the Typography of Textbooks (University of Chicago Press, 1931)
6. Department of Education and Science, A Language for Life (HMSO, 1975) p. 26.
7. Graham, W., ‘Readability and science textbooks’, School Science Review, 1978, 208, 59, 545-550.
8. Mobley, M., Evaluating Curriculum Materials: Unit 4, Assessing Comprehension (Longman for Schools Council, 1986, ISBN 0-582-17349-3)
9. Dale, E. and J. S. Chall, ‘A formula for predicting readability’, Educ. Res. Bull., 1948, 27, 11-20, 37-54.
10. Spache, G., ‘A new readability formula for primary grade reading materials’, Elem School Journal, 1953, 55, 410-413.
11. Harrison, C., Readability in the Classroom (Cambridge Educational, 1980, ISBN 0-521-22712-7 or 0-521-29621-8)
12. Klare, G. R., How to write Readable English (Hutchinson, 1985, ISBN 0-09-159611-4)
13. Yngve, H. V., ‘A model and an hypothesis for language structure’, Proc. American Phil. Soc., 1960, 104, 444-466.
14. Gunning, R. , The Technique of Clear Writing (McGraw-Hill, 1952)
15. Fry, E., ‘Fry’s readability graph: clarifications, validity and extension to level 17’, Journal of Reading, vol. 21, School of Education, Open University.
16. https:// www.nist.gov/itl/div894/ovrt/people/sressler/Persp/Views.html
17. Powers, R. D., Sumner, W. A., Kearl, B. E., ‘A recalculation of 4 readability formulae’, Journal of Educational Psychology, University of Birmingham, 49, 99-105
18. McLaughlin, H., ‘SMOG grading – a new readability formula’, Journal of Reading, 1969, 22, 639-646.
19. Sticht, T. G., ‘Research towards the design, development and evaluation of a job-functional literacy training program for the US Army, Literacy Discussion, 1973, 4, 3, 339-369.
20. Klare, G. R., The Measurement of Readability (Iowa State University Press, 1963)
21. Harrison, C. and K. Gardner, ‘The place of reading’ in Language across the Curriculum, ed. M. Marland (Heinemann, 1977)
Other reading
22. Carré, C., Language Teaching and Learning (Ward Lock, 1981, ISBN 0-7062-4106-1)
23. Cassels, J. and A. Johnstone, Understanding of Non-technical Words in Science, (Royal Society of Chemistry, 1980, ISBN 0-85186-369-8)
24. Cassels, J. and A. Johnstone, Words that matter in Science, (Royal Society of Chemistry, 1985)
25. Johnson, R. K., ‘Readability’, School Science Review, 1979, 212, 60, 562-568.
26. Johnson, C. K. and R. K. Johnson, ‘Readability’, School Science Review, 1987, 239, 68, 565-568.
27. Mobley, M., Assessing Curriculum Materials, Units 1-4 (Longman, 1986, ISBN 0-582-17347-7)
28. White, J. and G. Welford, The Language of Science (DES, Assessment of Performance Unit, ISBN 0-86357-086-0)
29. Lunzer, E. A. and W. K. Gardner, The Effectiveness of Reading (Heinemann for Schools Council, 1979)
« Just click on items in the menu to see more details.
If you have any queries, please e-mail them to: [email protected]
| Our Automatic Readability Checker takes a sample of your writing and calculates the number of sentences, words, syllables, and characters in your sample. (Note: We also have separate readability tools to calculate grade levels using the Fry Graph, Raygor Estimate Graph, Spache Formula, and New Dale-Chall Formula, located here: Free Readability Calculators and Text Tools). Directions: Paste in a sample of text and click "CHECK TEXT READABILITY." A sufficient sample size consists of 4-5 full sentences; approximately 200 - 600 words total. For larger texts, such as books, manuals, or dissertations, pull 1-2 sample sizes from each chapter. (Note: We limit the sample size to 3000 words. Sample sizes over 3K words are truncated.) Paste a sample of plain text in the box. Security check - Are you human?: Yes. (Click the box) Our free readability formula tool will analyze your text and output the results based on these readability formulas. Our tool will also help you determine the grade level for your text. 1. The Flesch Reading Ease formula will output a number from 0 to 100 - a higher score indicates easier reading. An average document has a Flesch Reading Ease score between 6 - 70. As a rule of thumb, scores of 90-100 can be understood by an average 5th grader. 8th and 9th grade students can understand documents with a score of 60-70; and college graduates can understand documents with a score of 0-30. 2. 3. The Fog Scale (Gunning FOG Formula) is similar to the Flesch scale in that it compares syllables and sentence lengths. A Fog score of 5 is readable, 10 is hard, 15 is difficult, and 20 is very difficult. Based on its name, 'Foggy' words are words that contain 3 or more syllables. 4. The SMOG Index outputs a U.S. school grade level; this indicates the average student in that grade level can read the text. For example, a score of 7.4 indicates that the text is understood by an average student in 7th grade. 5. The Coleman-Liau Index relies on characters instead of syllables per word and sentence length. 6. Automated Readability Index outputs a number which approximates the grade level needed to comprehend the text. For example, if the ARI outputs the number 3, it means students in 3rd grade (ages 8-9 yrs. old) should be able to comprehend the text. 7. Linsear Write Formula is a readability formula for English text, originally developed for the United States Air Force to help them calculate the readability of their technical manuals. Linsear Write Formula is specifically designed to calculate the United States grade level of a text sample based on sentence length and the number words used that have three or more syllables. StyleWriter software: use it to write better content! Download your free trial! | ||
How to calculate a person's age in Microsoft Excel
In spreadsheets created in Microsoft Excel, users often interact with a list of employees or other people, collecting general information about them.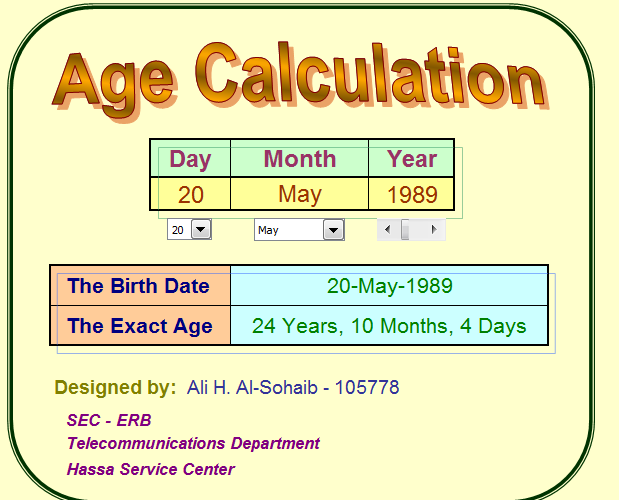 This includes the date of birth, which cannot always be quickly translated into a person's current age just by looking at the numbers.
In this article, I'll show you how to automate the calculation of a person's age, given their date of birth and today's date.
Preparatory steps
First, let's look at what you need to have in the spreadsheet to implement the task. Take a look at the following image - this is a simple layout with the names of employees and their date of birth. Field "Age" remains empty for now, but in the future the result of calculations using the formula will be placed there.
It remains only to indicate the current date in one of the free cells. You can do it manually, but it's much easier to call a special function, which will also be constantly updated to show the latest information.
To do this, find the same empty cell anywhere in the table, declare the function =TODAY() in it and press Enter to apply the changes.
No values need to be entered in the quotes themselves, the function will work correctly anyway. Pay attention to the fact that right now the cell shows the date that is set in your operating system (I think it's not worth saying that it should be correct).
If you want to learn more about the TODAY function, please follow the link below and read my other article on the topic.
Read also: How to use the TODAY function in Microsoft Excel
The community is now in Telegram
Subscribe and stay up to date with the latest IT news
Subscribe
Creating a formula for calculating age in Microsoft Excel a formula that will allow you to very quickly calculate the age of a person, starting from the two available values \u200b\u200b(they were discussed above). Further, this formula can be stretched to the entire length of the table and values can be added when needed.
-
Select the first cell in the column "Age" and call the function =FRACTION OF THE YEAR( .
-
For clarity, let's go to the window "Function Arguments" so that there are no problems with choosing suitable cells.
-
The date of birth of the person is used as the starting date, respectively, you need to click on the cell to add it to the arguments, or you can enter its number in the field manually.
-
End date is today, that is, you need to select the value of the function TODAY , which we declared earlier.
-
Basis is a method for calculating the day, which must be equal to one for age.
-
After entering all the information, press Enter and see the result.
-
You may see a lot of decimal places, which is not required to display the age, so open the list with tools "Number" and press the button to delete decimal places.
-
As you can see, all the values in the table are filled in and the correct age is displayed. Now the formula can be stretched, but more on that later.
Stretching the age formula
If you are an advanced user of Microsoft Excel, you can easily stretch formulas to pin certain cells. You can skip this step and complete the task yourself. For those who have not previously performed such an operation, I recommend that you read the following instructions. However, first I will say that you can stretch TODAY for the entire column so as not to freeze the cell.
However, displaying the same date on a whole column at least spoils the aesthetic appearance of the table, and at the most it is not always possible. Therefore, it is better to fix the cell, which is done like this:
-
Select the age formula field and add $ between the letter and number of the end date cell to indicate a constant.
 This will freeze the entire cell, not just the column or row. As a result, the number will look, for example, like $A$1 .
 -
Then hold down the left mouse button at the right border of the cell and drag it to the full length of the table until the end of the list of people.
-
Check that all ages are displayed correctly. If not, double-check that you have secured the cell correctly.
In conclusion, I note that when all decimal places are removed, the age will be rounded up if less than six months are left before the birthday. If you want to avoid this, leave one decimal place. Then the type of value will be as shown in the following image.
There is nothing difficult in calculating age in Excel, because the program has all the necessary functions for this, which also have a very simple syntax. I hope you have seen this for yourself.
Calculate age in years python
Need to calculate age for a list of clients, but my version swears:
from dateutil.relativedelta import relativedelta if df['Date of sale'] is not None and df['Date of birth'] is not None: df['Age'] = relativedelta(df['Date of sale'], df['Date of birth']).years else: df['Age'] = 10000
Throws an error:
The truth value of a Series is ambiguous. Use a.empty, a.bool(), a.item(), a.any() or a.all()
Advise on a solution?
- python
- python-3.x
6
Use pandas.DataFrame.apply for line-by-line operations. Example: parsing DataFrame from text, for both columns ( dob and buy ) convert data from text to date:
import.io import pandas as pd from dateutil.relativedelta import relativedelta raw = '''dob buy 03/18/1971 01/01/2019 12/08/1952 03/31/2018 01/09/1999 10/30/2010 08/16/1992 05/05/2019 03/13/1987 09/09/2018 None none None 01.01.2019 01/01/2019 None''' df = pd.

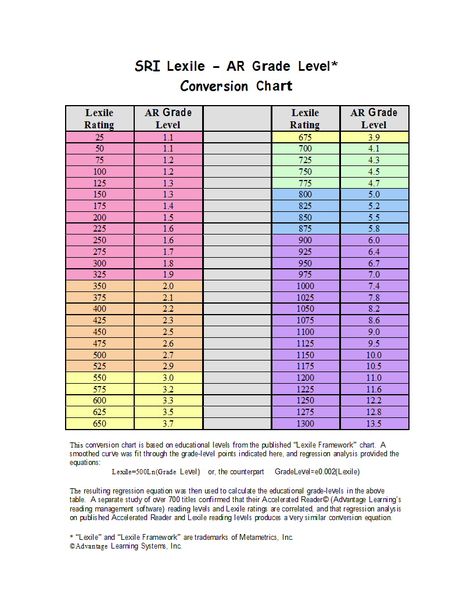
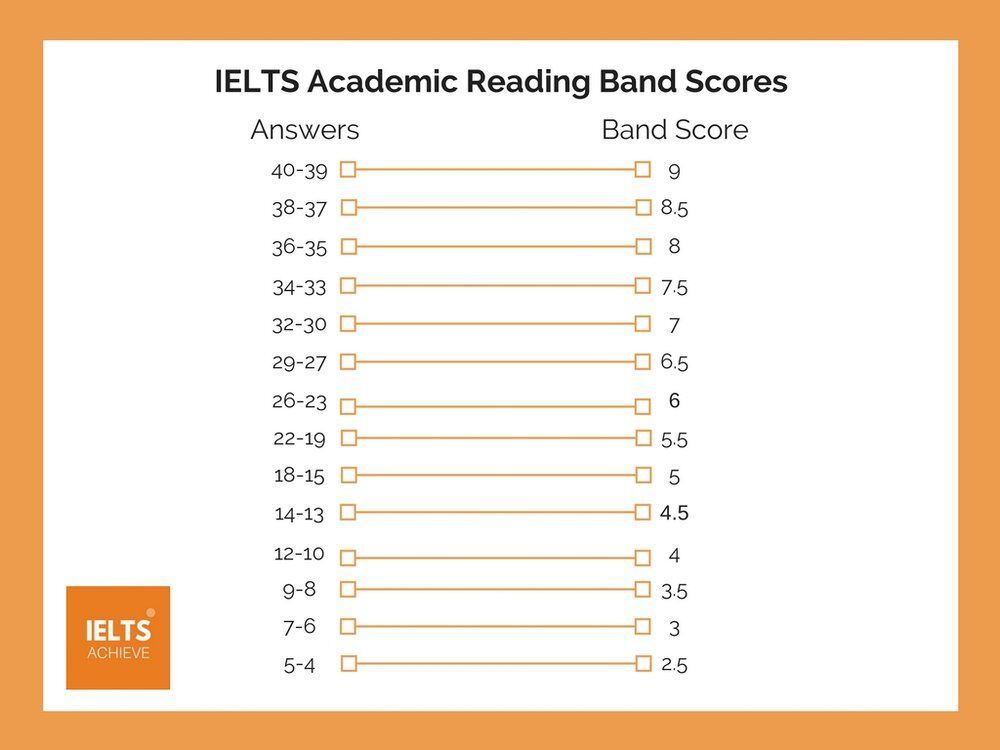 Our program takes the output of these numbers and plugs them into seven popular readability formulas. These readability formulas (see below) will let you know the reading level and grade level of your text and help you determine if your audience can read your writing.
 Your sample can be between 150-3000 words. We do not store or reuse your text in any way.
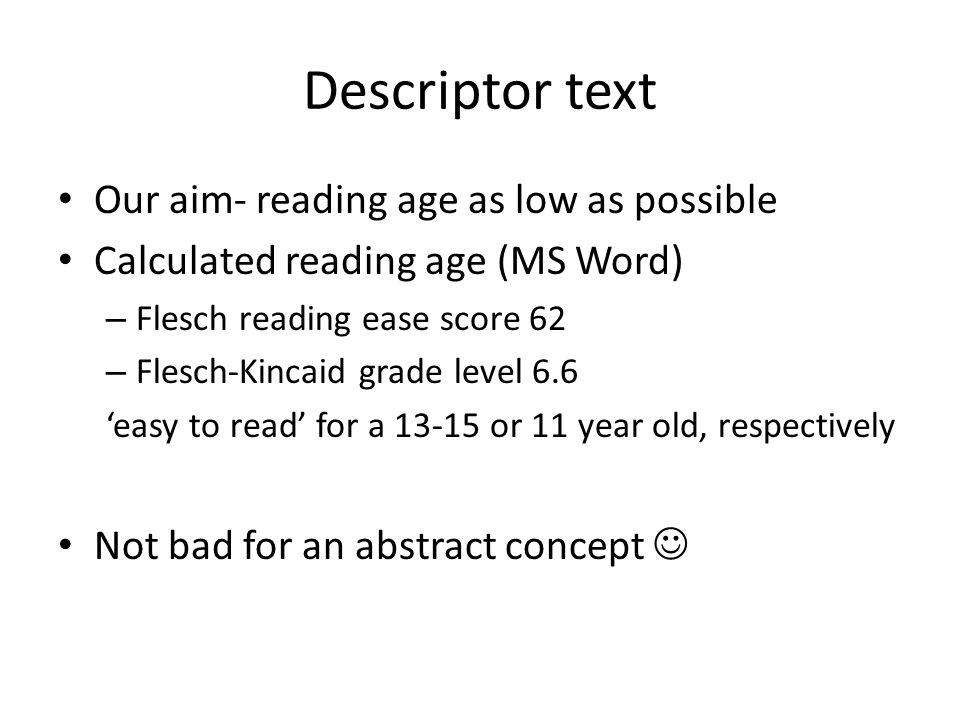 The Flesch-Kincaid Grade Level outputs a U.S. school grade level; this indicates the average student in that grade level can read the text. For example, a score of 7.4 indicates that the text is understood by an average student in 7th grade.
  This formula will output a grade. For example, 10.6 means your text is appropriate for a 10-11th grade high school student.