Next steps guided reading assessment
Next Step Guided Reading Assessment
Next Step Guided Reading Assessment
Data Management
Assess, Decide, Guide
Assess
Pinpoint your teaching focus, select texts, and plan and teach powerful lessons in four easy steps.
Decide
Use data to determine students’ reading levels, form instructional groups, and create effective action plans for student learning goals.
Guide
Access professional development tools, resources, and videos online to plan personalized instruction with lessons to match reading stages.
LOAD MORE
Get to know your readers in
four easy steps
1 . Reading Interest Survey (whole class)
Uncover students’ reading interests to match readers to just-right texts.
2. Word Knowledge Inventory (whole class)
Determine skills in phonological awareness and phonics to inform your word study instruction.
3. Comprehension Assessment (whole class)
Evaluate students' higher-level thinking skills and identify students who need immediate support. (For Grades K–2, this is administered as a read-aloud assessment.)
4. Reading Assessment Conference (one on one)
Obtain precise data on phonics, word recognition, fluency, and comprehension to determine instructional levels and identify skills and strategies to target during guided reading lessons.
Meet the Authors
Jan Richardson, Ph.D., is an educational consultant who has trained thousands of teachers and works with schools and districts to ensure that every student succeeds in reading. Her work is informed by her experience as a reading specialist, a Reading Recovery teacher leader, a staff developer, and a teacher of every grade from kindergarten through high school.
Maria Walther, Ed. D., is an author and expert in literacy with more than three decades of experience as a first-grade teacher in the Chicago area. She was honored as Illinois Reading Educator of the Year and earned the ICARE for Reading Award for fostering a love of reading in children.
Testimonials
Targets Instruction Efficiently
An all-in-one product that simplifies and clarifies the complex process of assessing and teaching reading. Gives teachers a full picture of a reader so they can target instruction more efficiently and effectively.
Rosanne L. Kurstedt, Ph.D.
Educational Consultant and Staff Developer
Westfield, NJ
Simple Yet Effective
The Assess-Decide-Guide framework is simple yet effective, and will undoubtedly increase the effectiveness of core instruction.
Terry J. Dade
Assistant Superintendent
Fairfax County Public Schools, VA
Clear and Pragmatic
The results have been amazing. Guided reading instruction is no longer a puzzle. Teachers are thrilled with the clarity and pragmatic shifts in their practice.
Ellen Lewis
Reading Specialist
Fairfax County Public Schools, VA
Valuable Teaching Points
Valuable teaching points can be derived from the simple checklists for decoding and retelling, as well as from the quality comprehension questions. The assessment texts are appropriately leveled and of high interest to kids, making this assessment a breeze to administer!
Melanie E. Smith
Reading Specialist, NBCT
South Salem Elementary School, Salem, VA
Teaching Resources and Materials | Scholastic Guided Reading Programs
Leveled
Bookroom
Professional
Learning
Next Step GR
Assessment &
Resources
Guided Reading
Toolkit
Differentiated Instruction
for Middle School
Leveled Bookroom,
3rd Edition
The NEW! Leveled Bookroom 3rd Edition
is where quality meets quantity.
The quantity of thousands of authentic texts across hundreds of themes, genres, and levels, written by renowned authors and illustrators, is paired with the quality of deep, research-based instruction to enrich teacher skills and prepare students for today’s academic demands.
Leveled Bookrooms are available in K–3, 4–6, and K–6 packages.
For more information, visit scholastic.com/leveledbookrooms.
Order Now
Download Order Form
Or call 1-800-387-1437
Mention Item: #568925 (K–6),
#568928 (4–6), #568927 (K–3)
Guided Reading Professional Learning Services
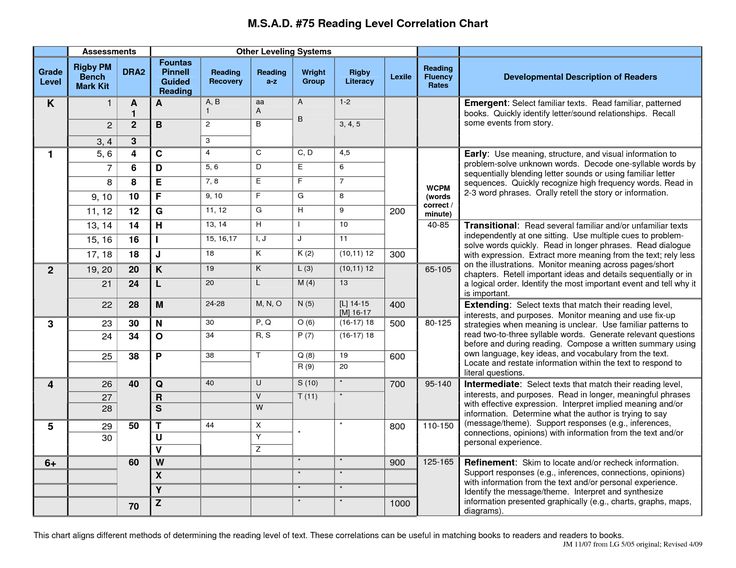
For over 30 years, Scholastic has worked with the authorities of guided reading to develop the most widely used guided reading programs in the country. We understand the benefits of guided reading and the misconceptions that prevent effective implementation. Whether you’re brand new to Guided Reading or more advanced, our Professional Learning Specialists provide courses and coaching sessions that can support you in facilitating students’ ability to process increasingly challenging texts.
Initiate a Comprehensive System of Professional Learning by recognizing where your team is, and offering opportunities to collaborate with master teachers.
Develop instructional best practices through ongoing, job-embedded coaching from our esteemed network of literacy specialists.
Sustain a culture of reading achievement with follow-up implementation training designed to maximize users’ understanding of and expertise with the program.
To learn more about our Guided Reading Professional Learning Services and for purchasing options, please visit scholastic.com/scholasticprofessional or call 1-800-387-1437.
Next Step Guided Reading Assessment—
Grades K–6
Developed by master reading teachers Jan Richardson, PhD, and Maria Walther, EdD, Next Step Guided Reading Assessment answers the call for a guided reading system that’s designed from the ground up to meet today’s rigorous standards.
Each kit includes:
- Original assessment texts
- Teacher’s Guide
- Reproducible assessment forms book and CD
- Assessment Conference Book
- Sturdy storage box
Learn more at scholastic. com/nextstepguidedreading
Order Now
Download Order Form
Or call 1-800-387-1437
Mention Item: #544268 or #544267
Your Complete Guide to Next Step Forward Teaching
The Next Step Forward in Guided Reading and The Guided Reading Teacher's Companion
All the planning and instructional tools you need to teach guided reading well, from pre-A to fluent, organized around Jan Richardson's proven Assess-Decide-Guide framework.
- Includes access to an online resource bank with dozens of downloadable assessment and record-keeping forms, lesson plan templates, and more than 40 short videos showing Jan modeling key parts of guided reading lessons for every stage
- The convenient flip chart guide helps teachers easily find prompts, discussion starters, and teaching points
Learn more at scholastic.com/janrichardson
Next Step Guided Reading in Action
Watch Jan Richardson lead targeted lessons that accelerate reading growth.
Each kit includes:
- Over 20 clips per grade level (120 minutes of video)
Learn more at teacherexpress.scholastic.com/NSGRA
Order Now
Guided Reading Toolkit
An essential resource for any teacher looking for support in the effective implementation of guided reading, the Toolkit features strategies for classroom management, direct connections to current standards, assessment, and resources for working with struggling readers and ELLs. Best of all, there’s a website with videos modeling guided reading.
Order Now
Download Order Form
Or call 1-800-387-1437
Mention Item: #565558
Differentiated Instruction for Middle School
Differentiated Instruction for Middle School
Based on the principles from literacy experts Fountas and Pinnell, this program offers a variety of authentic, leveled texts that are perfect for a variety of middle school classroom settings. Each kit covers Reading Levels W–Z and focuses on one type of literature—fiction, nonfiction, or content area. Nonfiction 2nd Edition and Text Types are coming soon!
Order Now
Download Order Form
Or call 1-800-387-1437
Mention Item: # 531384, #531383, or #531385
Azure Active Directory account security overview - Microsoft Entra
Twitter LinkedIn Facebook E-mail address
- Article
- Reading takes 2 minutes
There are three types of native service accounts for Azure Active Directory: managed identities, service principal, and user-level service accounts. Service accounts are a special type of account that represent non-human entities, such as an application, API, or other service. Such entities operate in the security context provided by the service account.
Azure Active Directory Service Account Types
For Azure-hosted services, we recommend that you use a managed identity, if available, or a service principal if not available. Managed identities cannot be used for services hosted outside of Azure. In this case, we recommend using a service principal. If a managed identity or service principal is available to you, use that. It is not recommended to use an Azure Active Directory user account as a service account. See the table below for a summary.
| Service location | Managed Identity | Service Principal | Azure account |
|---|---|---|---|
| The service is hosted by Azure. | Yes. Recommended if the service supports managed identity.  | Yes. | Not recommended. |
| The service is not hosted by Azure. | No | Yes. (recommended). | Not recommended. |
| Service supports multiple clients | No | Yes. (recommended). | No. |
Managed identities
Managed identities are secure Azure Active Directory (Azure AD) identities that are designed to provide identities for Azure resources. There are two types of managed identities:
For more information, see Secure managed identities. For an overview of managed identities, see What are managed identities for Azure resources?
Service principals
If you cannot use a managed identity to represent an application, use a service principal. A service principal can be used for applications that support one or more clients.
A service principal is a local representation of an application object in a single Azure AD tenant. It acts as the identity of the application instance, determines who has access to the application, and what resources are available to the application. A service principal is created in each client (locally) where the application is used and refers to a globally unique application object. The client secures the service principal's login information and access to resources.
There are two mechanisms for service principal authentication, client certificates and client secrets. Use client certificates whenever possible, as they are more secure. Unlike client secrets, client certificates cannot be accidentally injected into code.
For information about securing service principals, see Securing service principals.
Next steps
For more information about Azure service accounts, see:
Managed identity protection
Service principal protection
Azure service account management
Measuring Application Memory Usage - Visual Studio (Windows)
- Article
- Reading takes 6 minutes
Applies to: Visual StudioVisual Studio for Mac Visual Studio Code
Use the Memory Usage diagnostic tool built into the debugger to find memory leaks and identify inefficient memory usage. You can use the Memory Usage tool to take one or more snapshots of managed and private heap memory to understand the impact of object types' memory usage. You can also analyze memory usage without attaching a debugger - you just need to specify the running application. For more information, see Running profiling tools with or without a debugger. For information on choosing the right memory analysis tool, see Choosing a Memory Analysis Tool.
Although you can use the Memory Usage tool to take snapshots of memory at any time, you can use the Visual Studio debugger to control application execution during performance error analysis. Setting breakpoints, stepping, global breaks, and other debugger actions can help you focus on performance analysis when accessing the most important code paths. By performing these steps when the application is running, you can eliminate the impact of code that you are not interested in and significantly speed up the diagnosis of problems.
Important!
Debugger-integrated diagnostic tools are supported for developing .NET applications in Visual Studio, including ASP.NET and ASP.NET Core, native or C++ code, and mixed programs (based on .NET and native code). Running the Profile Tools with the Debugger (Window Diagnostic Tools ) requires Windows 8 and later.
This guide includes the following tasks:
- Creating snapshots with memory usage data
- Analysis of memory usage data
If the Memory Usage tool does not provide the data you need, you can use other profiling tools in the Performance Profiler that provide other kinds of information that you might find useful. Typically, application performance issues can be caused by components other than memory, such as CPU, UI rendering, or network request time.
Note
Custom distributor support . The internal memory profiler works by collecting memory allocation ETW events generated at run time. The allocators in the CRT and the Windows SDK are annotated at the source code level to allow their allocation data to be logged. If you create your own allocators, any functions that return a pointer to the newly allocated memory on the heap can be decorated using __declspec(allocator), as shown in this example for myMalloc:0003
__declspec(allocator) void* myMalloc(size_t size)
Memory usage data collection
-
Open the project for debugging in Visual Studio and set an application breakpoint at the point where you want to start checking memory usage.
If you suspect that a problem might be occurring in a particular area of memory, set the first breakpoint before the problem occurs.
Tip
Since changes in the amount of memory allocated can make it difficult to create a memory profile for the operation you are interested in, place breakpoints at the beginning and end of the operation, or step through it to try to find the point at which the amount of memory changed.

-
Set a second breakpoint at the end of a function or area of code that you want to analyze, or after a suspected memory problem occurs.
-
Window Diagnostic Tools will appear automatically if you have not disabled this feature. To open the window again, click Debug > Windows > Show Diagnostic Tools .
-
Select 9 from the toolbar0111 Memory usage using parameter Media selection .
-
Click Debug | Start debugging ( Start on the toolbar or F5 ).
Diagnostic Tools Summary view is displayed when the application has finished downloading.
Note
Because memory usage data collection can affect debugging performance of native and mixed programs, memory snapshots are disabled by default. To enable snapshots for native or mixed programs, start a debug session (key: F5 ).
 When the Diagnostic Tools window is displayed, go to the Memory Usage tab and select Heap Profiling.
 Stop (keyboard shortcut: SHIFT + F5 ) and restart debugging.
Note
Because memory usage data collection can affect debugging performance of native and mixed programs, memory snapshots are disabled by default. To enable snapshots for native or mixed programs, start a debug session (key: F5 ). When the Diagnostic Tools window is displayed, go to the Memory Usage tab and select Heap Profiling.
Stop (keyboard shortcut: SHIFT + F5 ) and restart debugging.
-
To take a snapshot at the start of a debug session, on the Memory Usage shortcut toolbar, select Take Snapshot .
 (Thus, you can also set a breakpoint here.)
 Tip
To get a baseline for comparing memory status, take a snapshot at the start of a debug session.
-
Run the script that triggered the first breakpoint.
-
After pausing the debugger at the first breakpoint, on the shortcut toolbar Memory Usage select Take Snapshot .
-
Press key F5 to run the application up to the second breakpoint.
-
Now create another snapshot.
At this point, you can begin to analyze the data.
Memory Usage Data Analysis
Memory Usage PivotTable rows list snapshots taken during a debug session and links to additional detail views.
The column names depend on the debug mode selected in the project options: .NET, Native Debugging, or Mixed Debugging (for .NET and Native).
If you take multiple snapshots, each row in the pivot table will display the difference from the previous snapshot.
To analyze memory usage data, click one of the links that opens a detailed memory usage report:
- To view detailed information about the difference between the current snapshot and the previous snapshot, click the change link to the left of the arrow ( ). A red arrow indicates that memory usage has increased, while a green arrow indicates that it has decreased.
Tip
To help identify memory issues more quickly, you can sort object types in change reports by largest increase in total size (click the Changes link in column Objects (diff) ) or by largest increase in heap size (click the link "Changes" in column Heap size (diff) ).
-
To display details for the selected snapshot only, click the No Changes link.
The report is displayed in a new window.
Managed Type Reports
Click the current link in cell Objects (diff) or Allocations (diff) in the Memory Usage PivotTable.
The top pane shows the number and size of types registered by the snapshot, including the size of all objects referenced by the types ( Inclusive size ).
In the tree Paths to the root The bottom area displays the objects referenced by the type selected in the top area. The .NET garbage collector only cleans up memory for an object when the last type that referenced it is deallocated.
The Objects referenced by tree displays links that are active for the type selected in the top pane.
The tree Types referenced by displays the links that are active for the type selected in the top pane.
To display instances of the type selected in the top pane, click the View Instances button next to the object type.
The Instances panel, which opens in the top pane, displays instances of the selected object in the current image. The Root Paths and Objects Referenced panels display the objects that refer to the selected instance, as well as the types that the selected instance refers to. If you take a snapshot after stopping the debugger and hovering over a cell in column The value is , the tooltip will display the values of the object.
Custom Type Reports
Click the current link in cell Allocations (diff) or Heap Size (diff) in the Memory Usage PivotTable displayed in the Diagnostic Tools window.
Type View shows the number and size of types registered by the snapshot.
-
Click the instances icon () of the selected type to display details of the selected type in the snapshot.
Window Instances displays all instances of the selected type. When you select an instance in the Selections Call Stack panel, displays the call stack used to create that instance.
-
To display information about objects of the selected type registered by the snapshot, select View instances of next to the selected type.
Window Instances displays all instances of the selected type. When you select an instance in panel Allocation Call Stack Displays the call stack used to create this instance.
Change Reports
-
In the Diagnostic Tools window, click in the required cell of the pivot table Memory usage difference in values.
-
Select a snapshot from the Compare to list that displays managed or native reports.
With the change report, you can add columns labeled (Diff) to the main report to display the difference between the two selected snapshots. A native type change report might look like this.