Next step guided reading assessment
Next Step Guided Reading Assessment
Next Step Guided Reading Assessment
Data Management
Assess, Decide, Guide
Assess
Pinpoint your teaching focus, select texts, and plan and teach powerful lessons in four easy steps.
Decide
Use data to determine students’ reading levels, form instructional groups, and create effective action plans for student learning goals.
Guide
Access professional development tools, resources, and videos online to plan personalized instruction with lessons to match reading stages.
LOAD MORE
Get to know your readers in
four easy steps
1 . Reading Interest Survey (whole class)
Uncover students’ reading interests to match readers to just-right texts.
2. Word Knowledge Inventory (whole class)
Determine skills in phonological awareness and phonics to inform your word study instruction.
3. Comprehension Assessment (whole class)
Evaluate students' higher-level thinking skills and identify students who need immediate support. (For Grades K–2, this is administered as a read-aloud assessment.)
4. Reading Assessment Conference (one on one)
Obtain precise data on phonics, word recognition, fluency, and comprehension to determine instructional levels and identify skills and strategies to target during guided reading lessons.
Meet the Authors
Jan Richardson, Ph.D., is an educational consultant who has trained thousands of teachers and works with schools and districts to ensure that every student succeeds in reading. Her work is informed by her experience as a reading specialist, a Reading Recovery teacher leader, a staff developer, and a teacher of every grade from kindergarten through high school.
Maria Walther, Ed. D., is an author and expert in literacy with more than three decades of experience as a first-grade teacher in the Chicago area. She was honored as Illinois Reading Educator of the Year and earned the ICARE for Reading Award for fostering a love of reading in children.
Testimonials
Targets Instruction Efficiently
An all-in-one product that simplifies and clarifies the complex process of assessing and teaching reading. Gives teachers a full picture of a reader so they can target instruction more efficiently and effectively.
Rosanne L. Kurstedt, Ph.D.
Educational Consultant and Staff Developer
Westfield, NJ
Simple Yet Effective
The Assess-Decide-Guide framework is simple yet effective, and will undoubtedly increase the effectiveness of core instruction.
Terry J. Dade
Assistant Superintendent
Fairfax County Public Schools, VA
Clear and Pragmatic
The results have been amazing. Guided reading instruction is no longer a puzzle. Teachers are thrilled with the clarity and pragmatic shifts in their practice.
Ellen Lewis
Reading Specialist
Fairfax County Public Schools, VA
Valuable Teaching Points
Valuable teaching points can be derived from the simple checklists for decoding and retelling, as well as from the quality comprehension questions. The assessment texts are appropriately leveled and of high interest to kids, making this assessment a breeze to administer!
Melanie E. Smith
Reading Specialist, NBCT
South Salem Elementary School, Salem, VA
Teaching Resources and Materials | Scholastic Guided Reading Programs
Leveled
Bookroom
Professional
Learning
Next Step GR
Assessment &
Resources
Guided Reading
Toolkit
Differentiated Instruction
for Middle School
Leveled Bookroom,
3rd Edition
The NEW! Leveled Bookroom 3rd Edition is where quality meets quantity.
The quantity of thousands of authentic texts across hundreds of themes, genres, and levels, written by renowned authors and illustrators, is paired with the quality of deep, research-based instruction to enrich teacher skills and prepare students for today’s academic demands.
Leveled Bookrooms are available in K–3, 4–6, and K–6 packages.
For more information, visit scholastic.com/leveledbookrooms.
Order Now
Download Order Form
Or call 1-800-387-1437
Mention Item: #568925 (K–6),
#568928 (4–6), #568927 (K–3)
Guided Reading Professional Learning Services
For over 30 years, Scholastic has worked with the authorities of guided reading to develop the most widely used guided reading programs in the country. We understand the benefits of guided reading and the misconceptions that prevent effective implementation. Whether you’re brand new to Guided Reading or more advanced, our Professional Learning Specialists provide courses and coaching sessions that can support you in facilitating students’ ability to process increasingly challenging texts.
Initiate a Comprehensive System of Professional Learning by recognizing where your team is, and offering opportunities to collaborate with master teachers.
Develop instructional best practices through ongoing, job-embedded coaching from our esteemed network of literacy specialists.
Sustain a culture of reading achievement with follow-up implementation training designed to maximize users’ understanding of and expertise with the program.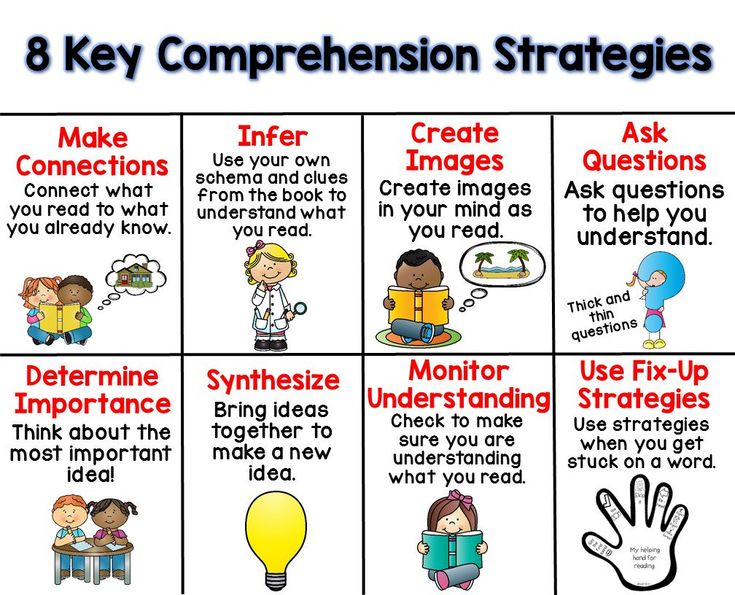
To learn more about our Guided Reading Professional Learning Services and for purchasing options, please visit scholastic.com/scholasticprofessional or call 1-800-387-1437.
Next Step Guided Reading Assessment—
Grades K–6
Developed by master reading teachers Jan Richardson, PhD, and Maria Walther, EdD, Next Step Guided Reading Assessment answers the call for a guided reading system that’s designed from the ground up to meet today’s rigorous standards.
Each kit includes:
- Original assessment texts
- Teacher’s Guide
- Reproducible assessment forms book and CD
- Assessment Conference Book
- Sturdy storage box
Learn more at scholastic. com/nextstepguidedreading
Order Now
Download Order Form
Or call 1-800-387-1437
Mention Item: #544268 or #544267
Your Complete Guide to Next Step Forward Teaching
The Next Step Forward in Guided Reading and The Guided Reading Teacher's Companion
All the planning and instructional tools you need to teach guided reading well, from pre-A to fluent, organized around Jan Richardson's proven Assess-Decide-Guide framework.
- Includes access to an online resource bank with dozens of downloadable assessment and record-keeping forms, lesson plan templates, and more than 40 short videos showing Jan modeling key parts of guided reading lessons for every stage
- The convenient flip chart guide helps teachers easily find prompts, discussion starters, and teaching points
Learn more at scholastic.com/janrichardson
Next Step Guided Reading in Action
Watch Jan Richardson lead targeted lessons that accelerate reading growth.
Each kit includes:
- Over 20 clips per grade level (120 minutes of video)
Learn more at teacherexpress.scholastic.com/NSGRA
Order Now
Guided Reading Toolkit
An essential resource for any teacher looking for support in the effective implementation of guided reading, the Toolkit features strategies for classroom management, direct connections to current standards, assessment, and resources for working with struggling readers and ELLs. Best of all, there’s a website with videos modeling guided reading.
Order Now
Download Order Form
Or call 1-800-387-1437
Mention Item: #565558
Differentiated Instruction for Middle School
Differentiated Instruction for Middle School
Based on the principles from literacy experts Fountas and Pinnell, this program offers a variety of authentic, leveled texts that are perfect for a variety of middle school classroom settings. Each kit covers Reading Levels W–Z and focuses on one type of literature—fiction, nonfiction, or content area. Nonfiction 2nd Edition and Text Types are coming soon!
Order Now
Download Order Form
Or call 1-800-387-1437
Mention Item: # 531384, #531383, or #531385
Navigating code with the debugger - Visual Studio (Windows)
- Article
- Reading takes 8 minutes
Applies to: Visual StudioVisual Studio for Mac Visual Studio Code
Use the Visual Studio debugger to step through code to inspect application status and view the execution sequence, also called by stepping through code . You can use keyboard shortcuts, debug commands, breakpoints, and other features to quickly jump to the code you want to examine. If you're familiar with the commands and keyboard shortcuts for navigating the debugger, you can quickly and easily find and fix problems with applications.
Note
If you are unfamiliar with debugging code, we recommend that you read the Debugging for Beginners document and Debugging Techniques and Tools before you complete the tasks in this article. nine0017
Entering suspend mode
In suspend mode , application execution is suspended, but functions, variables, and objects remain in memory. When the debugger is in break mode, you can navigate through your code. There are two standard ways to quickly enter break mode:
-
Start stepping code by pressing F10 or F11 . This will allow you to quickly find the application's entry point. You can then continue to press jump commands to move through the code.
 nine0017
 -
Execute code to a specific location or function, such as setting a breakpoint and running the application.
For example, in the code editor in Visual Studio, you can use the Run to current position command to run the application, attach the debugger, and enter break mode, and then press F11 to navigate through the code:
In break mode, you can navigate through the code using various commands. You can search for errors and data integrity violations by checking the values of variables. For some project types, you can also make adjustments in the application. nine0017
Most debugger windows, such as Modules and Watch , are only available when the debugger is attached to the application. Some debugger features, such as viewing variable values in the Local Variables window or evaluating expressions in the Watch Values window , are available only when the debugger is paused (that is, in break mode).
Note
If source files or symbol files (.pdb) are not loaded during code break, the debugger displays page Source file not found or Symbols not found which will help you find and download files. See Specifying Symbol (.pdb) and Source Code Files in the Visual Studio Debugger. If you cannot load source files or symbol files, you can debug assembly language instructions in window Disassemble .
Stepping through code
You can use debugger stepping commands to check the state of an application or examine its execution sequence. nine0017
Step into code
To stop execution on each statement while debugging, use the command Debug > Step Into or press the key F11 .
The debugger steps through code statements instead of physical lines. For example, the sentence if can be written on one line:
- C#
- VB
int x = 42; string s = "Not answered"; if( int x == 42) s = "Answered!"; nine0103But when stepping through this line, the debugger treats the condition as one step and the result as another step.
In the previous example, the condition is met.
When calling nested functions, the command Step into allows you to get to the deepest nested function. For example, if you use Step into on a call to
Func1(Func2()), the debugger steps into functionFunc2.Tip
As you run each line of code, you can hover over variables to see their values, or use the Local Variables and Watch windows to watch the values change. In addition, you can visually track the call stack as you step into a function. (For information specific to Visual Studio Enterprise only, see Method Mapping in Call Stack Visualization in Debugging.)0017
Stepping through code and skipping some functions
When debugging, you can skip a function. Or perhaps you know that some code works, such as well-tested library code. You can use the following commands to skip code during stepping. The functions still run, but the debugger skips them.
| Keyboard command | Debug menu command | Description | nine0133
|---|---|---|
| F10 | Step bypass | If the current line contains a function call, Step Over executes the code and then stops execution on the first line of code after control of the called function returns. |
| SHIFT + F11 | Step with exit | Command Step with exit resumes code execution and pauses execution when the current function returns. The debugger skips the current function. nine0140 |
Execute to a specified location or function
You may want to execute code directly to a specific location or function if you know exactly what code to test or where to start debugging.
Execute until a code breakpoint
To set a simple code breakpoint, click in the left margin next to the line of code where you want to pause execution. You can also select a line and press the 9 key0015 F9 , select command Debug > Toggle breakpoint or right-click and select command Breakpoint > Insert breakpoint . The breakpoint is displayed as a red circle in the left margin next to the line of code. The debugger pauses execution just before the line is executed.
Breakpoints in Visual Studio provide a rich set of features such as conditional breakpoints and tracepoints. For more information, see Using Breakpoints. nine0017
Execute until a function breakpoint
You can instruct the debugger to execute until a specific function is reached. You can specify a function by name or select it from the call stack.
Specify a function breakpoint by name
-
Select a command Debug > Create a breakpoint > Function breakpoint .
-
In the dialog box New function breakpoint enter the name of the function and select its language:
-
Click OK .
If the function is overloaded or located in several namespaces, the desired function can be selected in the window stops :
Challenge of the Call Steach
-
During debugging, open the window glasses by selecting item Debug > Windows > Call Stack .
-
In the Call Stack window , right-click the function name and select Run to Current Position or press CTRL + F10 .
For information about visually tracking the call stack, see Method Mapping in Call Stack Visualization in Debugging.
Execute until cursor
To execute code up to the cursor position, in the source code window or in the Call stack window select the line where you want to break execution, then right-click it and select Run to current position or press CTRL + F10 . Selecting command Run to current position is the same as setting a temporary breakpoint.
Force execution to cursor position
To execute code to cursor position, in source window or window Call stack select the line where you want to break execution, then right-click it and select Force Run To Cursor (Forced execution to the cursor location). If you select parameter Force execution to cursor , all breakpoints and primary exceptions will be skipped until the debugger reaches the line of code where the cursor is.
Execute until clicked
While the debugger is paused, you can hover over a statement in source code or in window Disassemble and click the green arrow icon Run to this location . If command is used Execute until clicked allows you not to set a temporary breakpoint.
Note
The Run to Click command is available starting with Visual Studio 2017. 0015 SHIFT , and select item Force execution to current position (icon with two green arrows). When this option is selected, the application attaches the Visual Studio debugger and pauses at the cursor position. All breakpoints and primary exceptions encountered during execution are temporarily disabled.
Note
The Force to Click command is available starting with Visual Studio 2022.
Manually pausing code execution
To pause execution at the next available line of code in a running application, select Debug > Break All or press CTRL + ALT + BREAK .
When the debugger is paused, a yellow arrow in the source code field or window Disassembled code marks the location of the next statement to be executed. You can change the next statement to be executed by moving this arrow. You can skip the code or return to the previous line. Moving the pointer is useful for situations such as skipping code that contains a known bug. nine0017
The debugger must be in break mode to change the next statement to be executed. In the source window or the Disassembled Code window, drag the yellow arrow to another line, or right-click the line you want to execute next and select Set Next Statement .
The program counter jumps directly to the new location. Instructions between the old and new points are not executed. However, moving the execution point back does not cancel intermediate instructions. nine0017
Attention!
- Moving the next statement to a different function or scope usually corrupts the call stack, causing a run-time error or exception. If you try to move the next statement to another area, the debugger will issue a warning and a chance to cancel the operation.
- In Visual Basic, you cannot move the next statement to another scope or function.
- In native C++ code, if runtime checks are enabled, setting the next statement may throw an exception when execution reaches the end of the method. nine0004
- When the Edit and continue operation is enabled the Set next statement command will fail if you make changes that the Edit and continue operation cannot apply immediately. For example, this could happen if changes were made inside the catch block. When this situation occurs, an error message appears indicating that the operation is not supported.
- In managed code, you cannot move the next statement in the following cases:
- The next statement is in a different method than the current statement.
- Debugging has been started via JIT debugging.
- The call stack is being cleared.
- A System.StackOverflowException or System.Threading.ThreadAbortException was thrown.
Debugging non-custom code
By default, the debugger tries to debug only your application code, because feature 9 is enabled0019 Only my code is . To learn more about how this feature works with different project types and languages, and how to set it up, see Just My Code.
To view platform code, third-party library code, or system calls while debugging, you can turn off Just My Code. Under Tools (or Debugging ) > Options > Debugging , uncheck Include just my code . When Just My Code is disabled, debugger windows display non-user code, and the debugger can step through it. nine0017
Note
Just My Code mode is not supported for device projects.
System code debugging
If you have downloaded debugging symbols for Microsoft system code and disabled Just My Code, you can step into a system call just like any other call.
For information about downloading Microsoft symbols, see Configuring Symbol File Locations and Download Options.
To download symbols for a specific system component: nine0016
-
During debugging, Open the window Modules , selecting paragraph Debugging > Windows > Modules or by pressing the keys CTRL + ALT + U .
-
You can determine for which modules the symbols are loaded by looking at the value in column Symbol Status in window Modules . Right-click the module you want to load symbols for and select Download symbols .
Stepping into properties and operators in managed code
By default, the debugger bypasses properties and operators when stepping through managed code. In most cases, this improves the convenience and efficiency of debugging. To disable property and statement stepping, select Debug > Options . On page Debug > General uncheck Bypass properties and operators (managed code only) .
See also
- What is debugging?
- Debugging methods and tools
- Getting Started with Debugging
Connect Azure Monitor SCOM Managed Instance (preview) to the Ops console
Twitter LinkedIn Facebook E-mail address nine0017
- Article
- Reading takes 2 minutes
Azure Monitor SCOM Managed Instance (Preview) is compatible with System Center Operations Manager 2022.
After creating a SCOM Managed Instance (preview) in Azure, connect the instance to the Ops console to set up workloads and monitor.
Follow these steps to connect SCOM Managed Instance (preview) to the Ops console:
-
Specify the server to install the Ops console. Determine the server on which you want to install the ops console.
Note
Do not run this on a SCOM Managed Instance (preview) virtual machine, but on a separate virtual machine. The virtual machine must be Windows Server. This server can be local or in Azure. nine0017
-
Installing the Ops Console : From the executable, install the management console and follow the installation wizard to successfully install the Ops console.
-
Connect SCOM Managed Instance (preview) to the Ops console . Sign in to the Ops console and select Connect to server . Add the FQDN that points to the management servers.