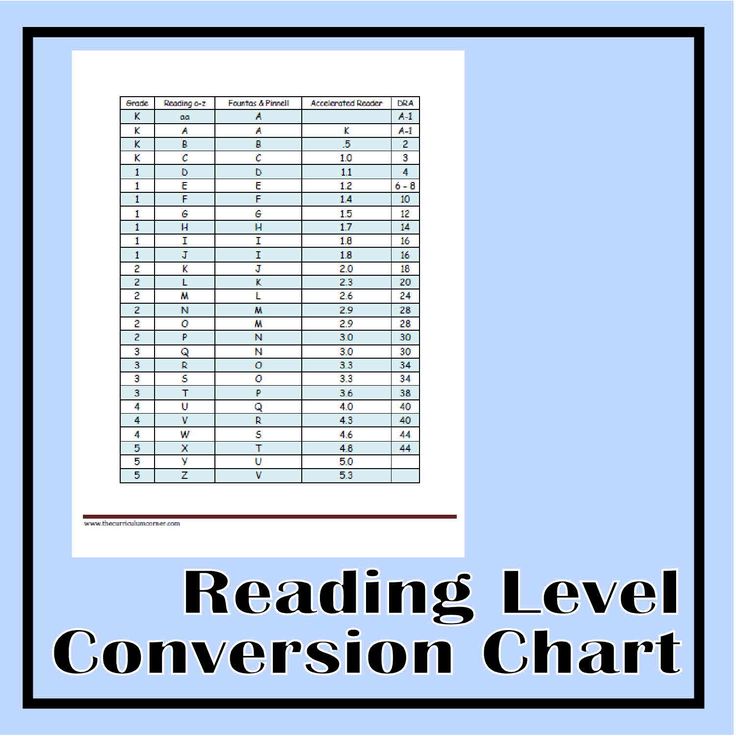
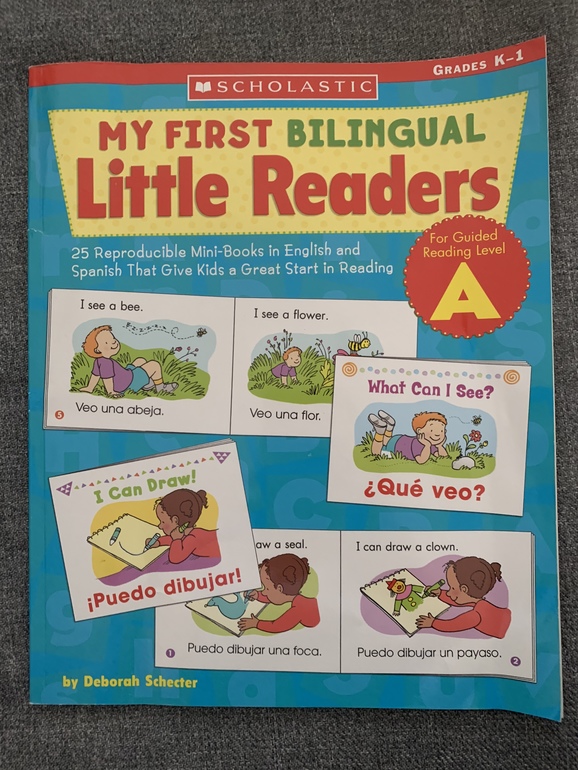
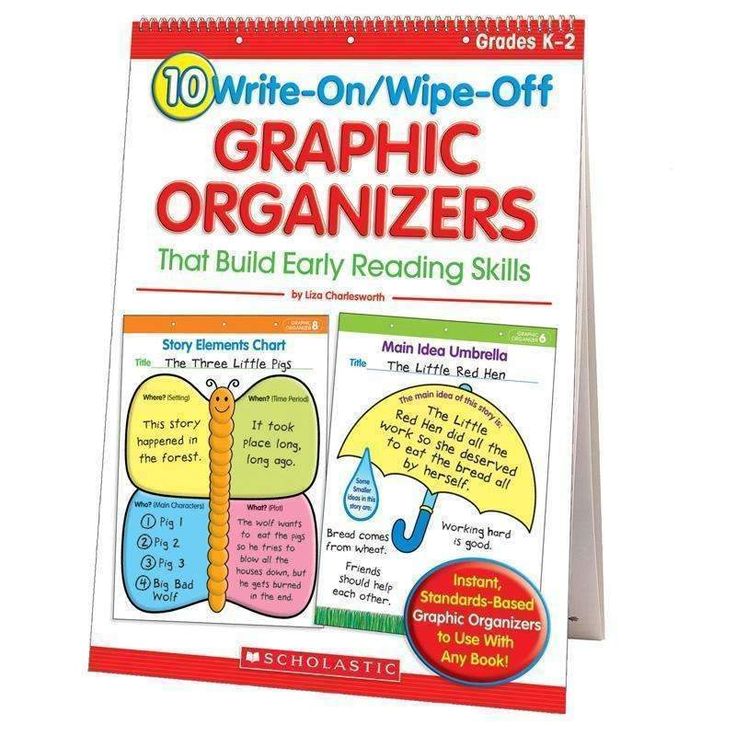
Scholastic book levels chart
How to Determine the Reading Level of a Book
This content contains affiliate links. When you buy through these links, we may earn an affiliate commission.
Fountas and Pinnell, Lexile Level, Primer, Pre-primer, Beginning Reader are all terms you may have heard if you have a young reader in your house. Seriously, what does it all mean? Is there actually a way how to determine the reading level of a book? If your child can read The Cat in Hat, which is a level J in Guided Reading, can she independently tackle Diary of a Worm, which has a Lexile Level of 510L or is she ready for Keena Ford and the Second Grade Mix-Up, even though that one has a DRA of 30?
Through this post, I am going to attempt to elucidate and explain reading levels. So scroll through to find the system that your child’s teacher uses or pour yourself a large cup of coffee and sift through all of the various ways educators, librarians, and book publishers level and categorize books for young readers.
Reading Levels Are Like Starbucks Sizes
I admit, I don’t visit Starbucks unless I have a gift card. I am also that person who goes to Starbucks and still tries to order a large iced tea. The barista calmly asks if I would like a venti or a trenta and then explains that I need to choose between Passion Tango, Matcha Green, or Guava White Tea. Then comes the question of sweetened, unsweetened, or added lemonade.
For the young reader, finding a book that can be read independently can be as tricky as remembering all of the variables in a Starbucks order. Little readers who are not familiar with reading levels or taught to find a “good fit book” often go for books that are too easy and boring, too difficult and frustrating, or, like my kindergarten son, books that have too many unreadable Star Wars planet names like Kashyyyk. If a child knows her reading level, she can find books that contain sight words she knows, plot lines that are not too advanced, and vocabulary that is manageable.
Explain the Levels, Please
There are many different ways that books are leveled. Here are the three most popular methods for how to determine the reading level of a book.
Developmental
Children become readers by moving through different developmental reading stages. These stages range from the emergent pre-reader to the expert fluent reader. Typically, the emergent pre-reader is between six months and six years of age, while the expert fluent reader is 16 years and older. The developmental categories are broader categories than many of the other leveling systems.
Letter Levels
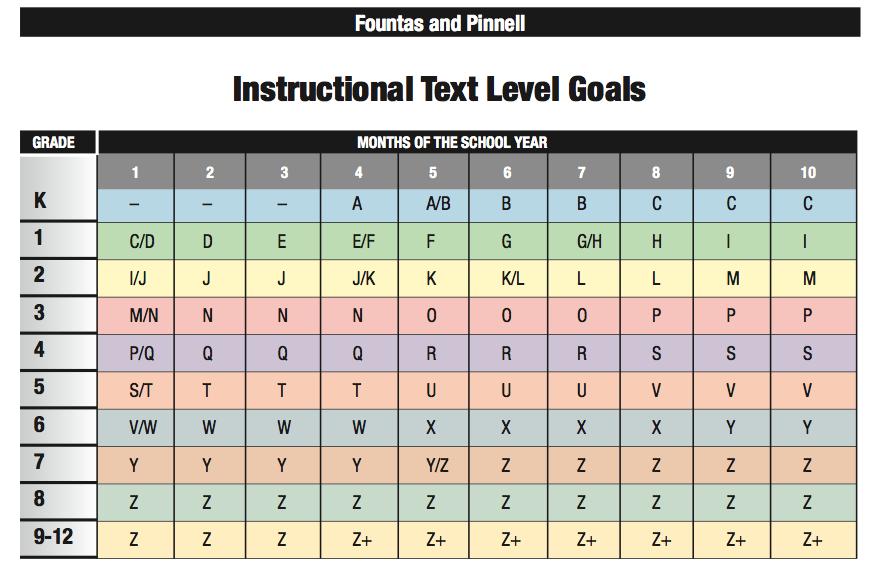
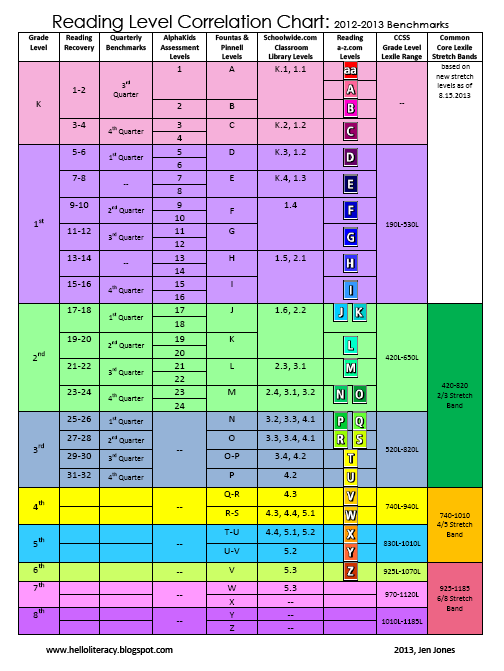
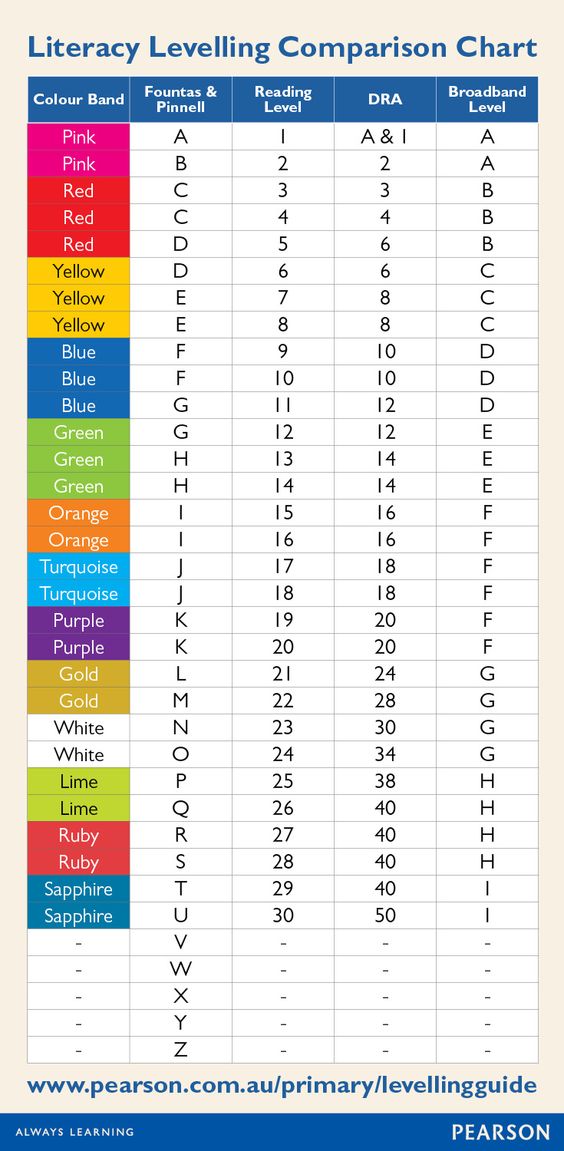
When I taught first and second grade, I found letter levels to be the most kid friendly way to organize a classroom library. If your child’s school levels books using Fountas and Pinnell, Reading A-Z, Scholastic Books, or Guided Reading Levels, then books will be leveled using a letter system. While it would be nice, these leveling systems do not always correlate. A book that is a Reading A-Z Level P, is not always a Level P using the Guided Reading Levels.
Number Levels
Books can be leveled through such systems as Lexile Numbers, The Direct Reading Assessment (DRA), and Reading Recovery. These systems measure texts by complexity and a reader’s skill level and then assign a number.
I Have My Child’s Reading Level, Now What?
Throughout the school year, your child’s teacher will probably perform reading inventories or assessments with your child. These will determine your child’s reading level.
If you homeschool or your child’s school does not use leveled reading, then use a simple test called the “five finger test” to roughly determine your child’s reading level. Have your child choose a book and open to the second page. Ask your little one to read the text out loud. If your child struggles with independently reading five or more words on that page, the book is too difficult and is not a good fit. You should also ask some comprehension questions to make sure that your young reader understands what she is reading.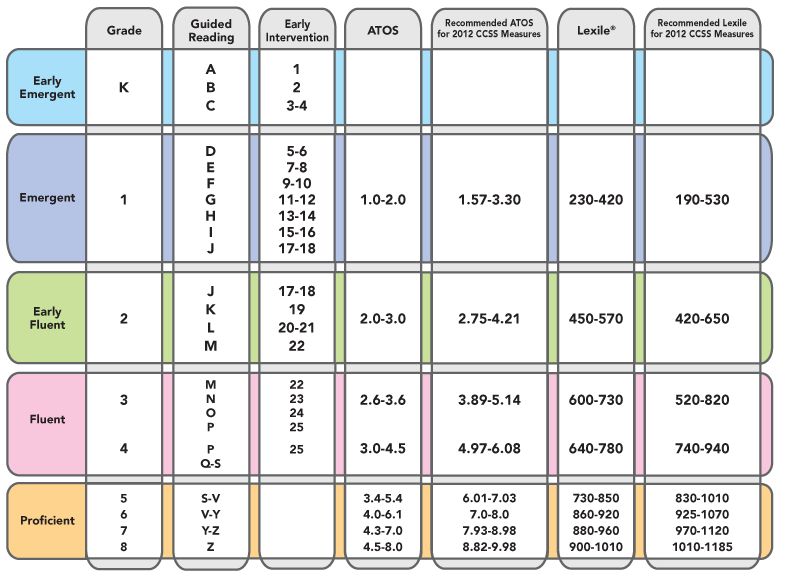 When a book passes the five finger test, use one of the links below to determine that book’s reading level.
Once you have the reading level, take a look at these five helpful websites, apps, and charts that will help you and your child find or level the perfect book:
- Book Wizard : Type in the title of a book to retrieve the Guided Reading Level and grade level.
- Lexile Find-a-Book :Visit this site to find the Lexile Number for a specific book or to generate a list of books with a particular Lexile Number.
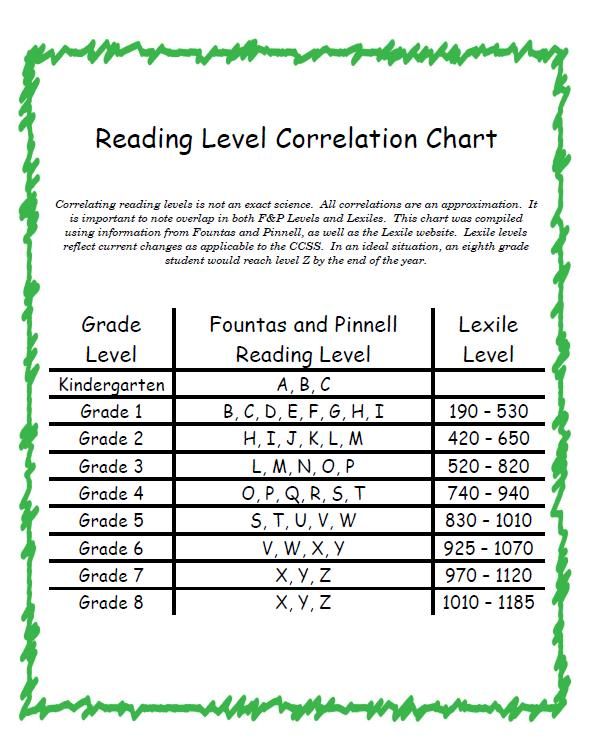
- Reading A-Z Level Correlation Chart : This is the best conversion chart out there for reading levels.
- Reading Levels Explained : Check out this very clean and user friendly site if you are still feeling overwhelmed by all of the reading level systems.
- Literacy Leveler app : Download this app and then use it to scan a book’s ISBN to see its Lexile, DRA, and GRL.
Levels Should be Helpful, Not Stressful
Reading levels should not feel restrictive. They should be used as helpful tools and not as a draconian system that kills the love of reading. Encourage your child to read books on her level, but don’t be upset if she chooses to reread an old favorite or picks up a nonfiction book that has some advanced vocabulary. Imagine how horrible it would be if adults had to always adhere to a reading level. I am well aware of the fact that some of my beach reads are probably a fourth grade reading level, with a Guided Reading Level of Q, 820L, and DRA of 40. I may not always be challenged as a reader, but it is still fun to sip my trenta Passion Tango unsweetened iced tea and enjoy a book simply for the fun of reading.
Need some books to practice leveling? Help yourself to 50 Must-Read Books for Beginning Readers, 20 Must-Read Books for First Graders and Second Graders, The Best Chapter Books for Kids: Engaging with Words, and 70 Must-Read Books for 3rd Graders.
The Guided Reading Levels Chart and What It Means
Have you ever found yourself using a system, but not really knowing why? Maybe you are using it because someone introduced you to it and you just rolled with it.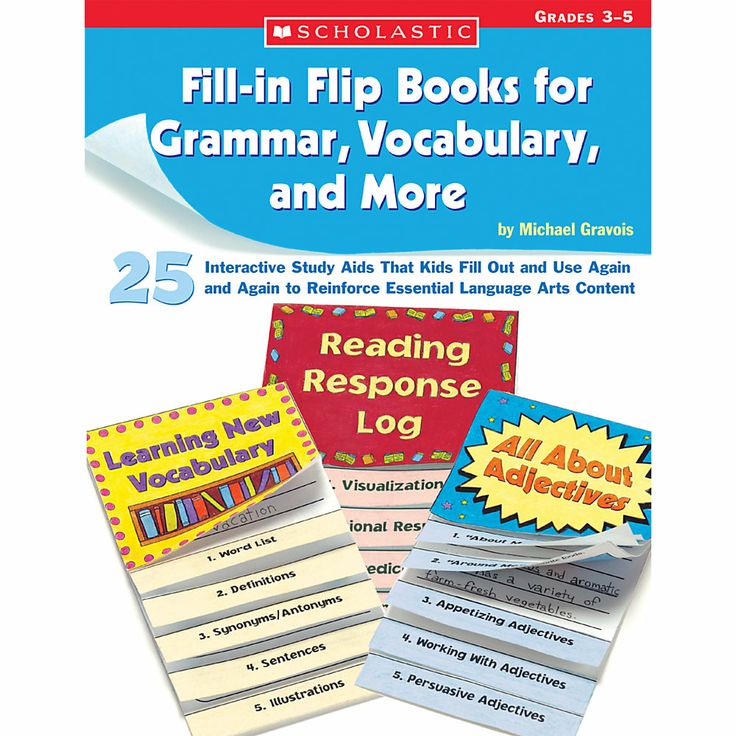 Maybe you have found yourself using it because you knew there was a purpose but weren’t sure what it was. I know I have been in this place. I have been there with guided reading levels and the guided reading levels chart for sure.
When I first started teaching guided reading, I found myself wondering things like, “What does this guided reading level mean?” Or “What does this have to do with how this child is learning to read?” Or even “Why on earth are some numbers and other’s letters?”
I want to help make things clear for you so I am sharing all I can about guided reading levels, the guided reading levels chart, and what it all means.
What are guided reading levels?
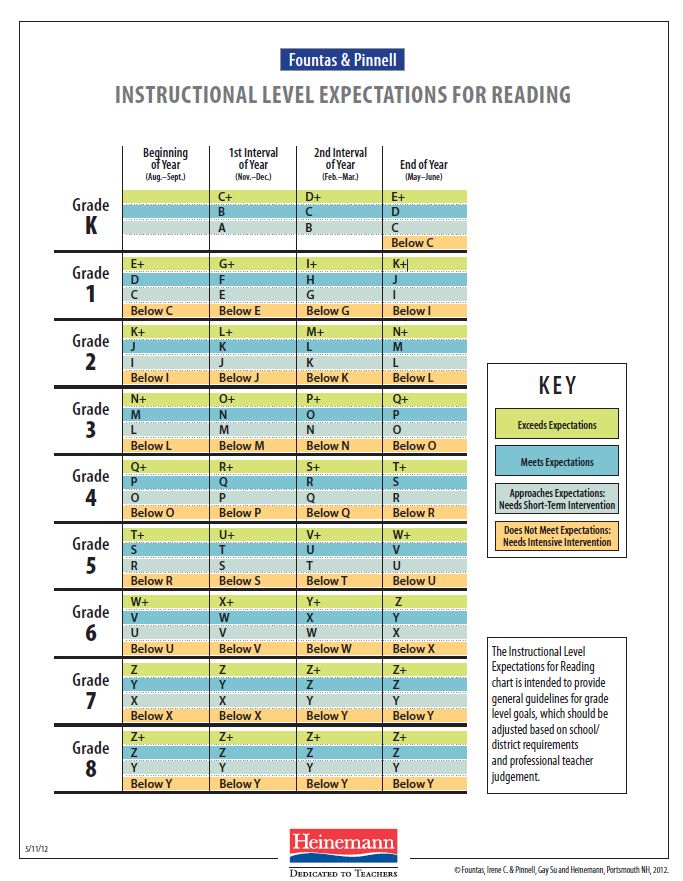
Guided reading levels are simply a system developed originally by Irene Fountas and Gay Su Pinnell to help organize reading skills and strategies so that readers are not overwhelmed. The goal of guided reading is to work within a child’s instructional level. Anything above that can cause frustration for the reader and anything below does not allow for enough teachable moments.
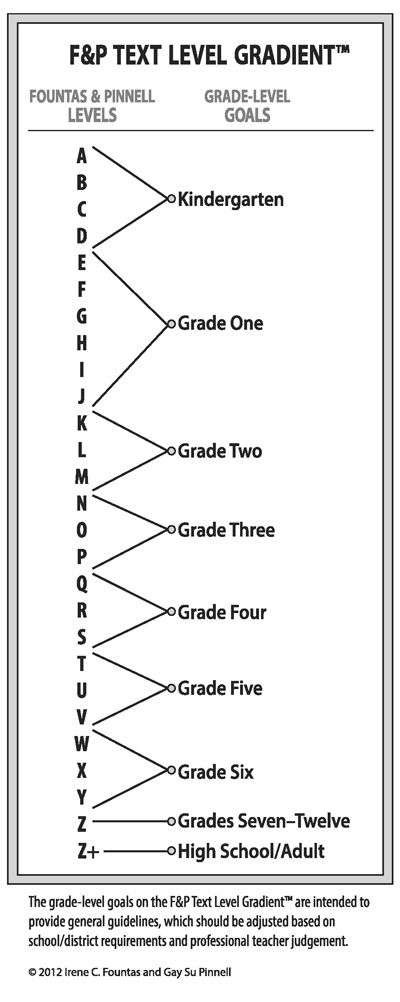
The most common system for leveling is Fountas and Pinnell’s guided reading levels system which uses letters to indicate each level. It ranges from levels A-Z with A being the simplest and Z being the most complex of the guided reading levels. Other popular systems are DRA, which uses numbers, Reading A-Z, and Rigby. Lexile levels are another familiar system that uses large ranges. Personally, I have found this system to be the most difficult to work within.
All good teachers teach within a “system” naturally. Never would we dump algebra on a child who is learning basic number patterns, yet the number patterns will set them up for later success in deeper math concepts!
Books are assigned reading levels and as children are assessed, children are given leveled books to work within that do not overwhelm them. The goal is that they have a useful tool that allows the teacher to come alongside them and coach them through.
Remember, children are not assigned levels.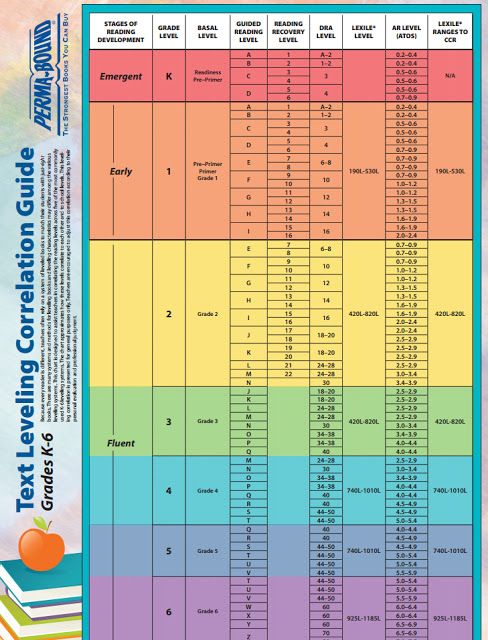 Books are assigned levels.
 This is something that I am guilty of in the past and while it can be wonderful motivation for some as they work to move up levels, it’s also not great for many.
How do you determine a guided reading level?
Guided Reading Levels for Books
Assigning a guided reading level to a book is complex. Many factors are taken into account. Scholastic lists the following:
Genre: The type of book (here’s your guide to children’s book genres)
Text Structure: How the book is organized and presented
Content: The subject matter of a book
Themes and Ideas: The big ideas that are communicated by the author
Language and Literary Features: The types of writing techniques employed by the writer
Sentence Complexity: How challenging the syntax in each sentence is
Vocabulary: The frequency of new words introduced in the book
Words: The ease at which the words in the book can be figured out or decoded by a reader
Illustrations: The correlation and consistency of images and pictures in the books to the words printed on the page
Book and Print Features: The physical aspects of the printed word on the page –Mary Doman, A Parent’s Guide to Guided Reading, Scholastic.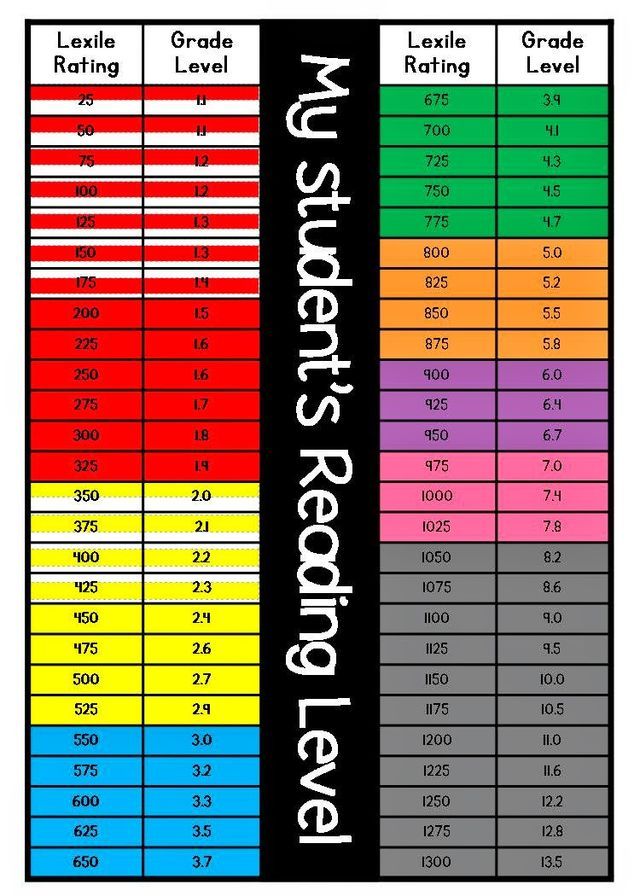 com
com
Just remember there is no perfect book and no perfect system. I know firsthand from leveling my own sets of guided reading books that it’s super tricky and one word can change the whole level! Being aware of your readers’ skills is so important!
Matching Just Right Books with Children
When it comes to matching guided reading levels with readers, there are a few ways you can do this. If you are a teacher, the best way to is to take a running record. This will allow you to get accurate data on the child and really see their strengths and growing points. If you are a parent, you can use a simple five finger test to determine if a book is too hard or just right. Every time a word is missed, the child raises a finger. Once they get to five, they know it’s too tricky right now.
It’s important to remember that when searching for a good fit you take into consideration more than just the text. You must also consider comprehension. If a child is struggling to comprehend the text, then it’s likely too hard.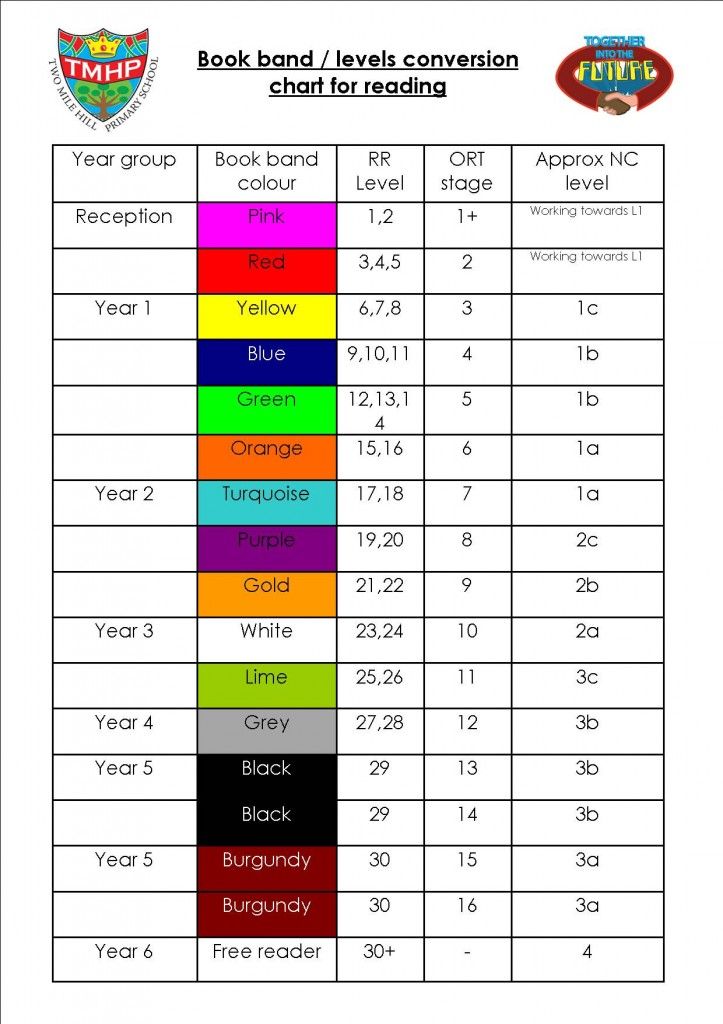 If the child can comprehend it well and can read it well, then it may be too easy for the child.
What does each of the guided reading levels mean?
So what do each of the guided reading levels mean? I love to look at them from the perspective of what they encourage readers to be working towards and how much a child can do when they advance levels.
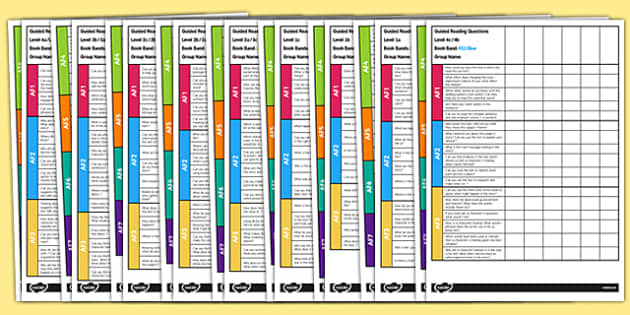
In my guided reading resource card FREEBIE, all of the strategies, skills, behaviors, and comprehension focuses are explained at each level. They not only help you, the teacher, meet your readers where they are, but they help you have a roadmap to see where they are going next, too.
I love to use them when planning my guided reading lessons!
Where do I go from here?
Once you know where a reader is working and you know that you have leveled text, you may be looking for some easy to follow guided reading lessons. After years of planning my own lessons and hearing from teachers that they weren’t sure where to even begin, I created guided reading lessons for Kindergarten, First Grade, and Second Grade readers.
The lessons have an easy to follow format, guided reading books, notes about each level and where students are working, word work activities, comprehension activities to follow up the text reading, and even notes for parents.
Shop Kindergarten Guided Reading Lessons
Shop First Grade Guided Reading Lessons
Shop Second Grade Guided Reading Lessons
No matter where you are in your guided reading journey, it’s important to simply begin and keep moving forward. Teachers, myself included, are always learning, growing, changing our practice, and improving! I’m rooting for you!
pin it
Want to use the latest research to boost your readers during small groups? This FREE guide is packed with engaging ideas to help them grow!
10 steps to fix it
Nastya Neustroyeva
Learned English for 18 years
I studied English for 18 years.
I am from Yekaterinburg. From the age of six I went to an English club, then I learned the language at school, with tutors and at a university. Now I have a diploma in translation, and for the last seven years I have worked as a marketer at a language school. There I also took two English courses - and only then did I reach the C1 level, the fifth of six possible according to the CEFR system. This means that I speak fluently, understand complex texts and speech with an accent, and also use the language for work.
But before that, among my colleagues, I felt inferior. Like many students of the school, I could not master the language for a long time. They also went to tutors, watched TV shows in English, downloaded tutorials, but still stomped on the same level.
As a marketer, I analyzed and discussed with teachers the problems of such students. As a result, I realized that it was preventing me from learning English, and I personally corrected this for myself. I share with you my discoveries.
To learn English, I spent 119 in 18 years820 R
| Three years of tutoring at school | 66 600 R, 300 R per lesson |
| Year of study with a tutor from a university | 37 000 R, 1000 R per lesson |
| CAE Exam | 11 690 Р |
| TOEFL Practice Test with 25% discount | 2333 R |
| University textbooks | 2197 R |
| Language school textbooks | 2000 R |
| Language school | 0 Р |
Three years of classes with a tutor at school
66 66 600 r, 300 r for a lesson
years of class with a tutor from the university
37 000 r, 1000 r for lesson
Exam CAE
690 r
TOEFL trial test with 25% discount
2333 R
University textbooks
2197 R
Language school textbooks
2000 R
Studying at a language school
0 R
Why the language was not good for me
How easily and quickly English is given depends on your abilities. The better developed logic, perception and memory, the easier it is to learn a language. Some students can't get ahead in English because their brains just aren't ready for it.
But more often there is no progress for simpler reasons. I had six of them.
There was no clear goal. At school, I couldn't decide who I want to be, but at the university I realized that translation is not for me. I did not plan to travel or emigrate, and I had no English-speaking friends. Without an incentive, I often skipped classes and could not boast of good grades.
8 proven ways to learn English without a tutor
But then I got a job and I realized why I need English. There I had to write letters on it, read instructions during exams, and communicate with foreigners. I was motivated to understand the rules, speech styles, learn new words and practice speaking.
The teachers didn't fit. I just didn't like some of them. For example, a school teacher was diligent, but did not know the language well: she repeated the same phrases all the time and explained the rules incomprehensibly.
And the tutor had excellent English, but she gave me a grammar book for half a lesson and went to drink tea. In general, grammar still disgusts me.
It was psychologically difficult for me with other teachers. I remember how at the university they evaluated not the result of work, but my personality and scared me with expulsion. So the desire to go to couples disappeared.
Wrong format. After school and university, I tried to study with teachers on Skype. But then the online format was just emerging and was inconvenient. I kept the exercises as photos on my phone, looked for new words in the chat, and tasks in the mail. As a result, I got confused and often forgot to learn something.
Then I realized that group classes suited me. I like to communicate and feel supported, besides, there is a competitive effect in the group.
Method did not fit. Previously, in most schools, they studied using the grammar-translation method: they mastered the rules of the language and translated texts. As a result, I had no problems with reading and translation, but I could not speak English.
There are other methods. For example, the communicative one teaches you to communicate, and the project one teaches you to present your ideas in English. In addition, they can be combined. Which one to choose depends on your goals.
Was not interesting. At school I was forced to read boring texts about Shakespeare and watch cartoons about Muzzy, which I didn't like. And at the university, I translated academic and technical texts. All this was not connected with my life, and the language seemed dead and boring.
There was not enough money. Teachers at work explained to me that each student has his own characteristics, so individual lessons are the most effective, I would quickly close knowledge gaps on them. But I couldn't pay 12,000 R for eight lessons a month. Therefore, I studied in a group: it was free for employees, otherwise it would have cost 4400 R per month. However, I asked for additional tasks in order to work out the mistakes, or I myself found the material in textbooks and applications.
I gradually became aware of these problems - when I worked with clients and felt that their pain echoed in me. And then she began to solve them step by step.
/english-za-86000/
I learned English from scratch for R86,000
Step 1
Find out your levelTo choose a teacher and class format, you first need to determine your language level. To do this, it is not necessary to take expensive and difficult exams like TOEFL and IELTS - fairly quick online tests.
They are often given at language schools when you go there to enroll. There is a good free EF SET test, it lasts 50 minutes. And I myself took the Oxford English Placement Test. It walked for an hour and a half and cost 500 R. I read texts on the computer, listened to audio and answered questions. As a result, I received a clear report on my level.
/cambridge-fce/
How much does it cost to take the Cambridge English exam
In general, language level is a relative concept. For example, when I started to study in a group, I was considered a student with a B2 level. I understood the main ideas in speech and text, I spoke fluently, I was understood by native speakers. I could also describe abstract concepts, justify my thoughts and write an essay on an unfamiliar topic. But at the same time, I constantly forgot to add the ending -s in verbs, although this is taught at the very beginning.
So don't expect the level to accurately reflect knowledge. You need to know it just for reference.
Each level corresponds to a certain set of skills. Source: oxford-house.ru After EF SET you will receive points and a short explanation about your levelStep 2
Decide on the format and expenses I think that it is impossible to learn English for free and on your own. YouTube lessons, tutorials, and apps don't teach you how to actively use the language. Of my acquaintances, only teachers of another foreign language learned English themselves. They already knew how to select material and analyze mistakes, and practiced with native speakers.
If you are not a foreign language teacher, it is better to study with a professional. Such classes are group and individual, in a language school or with a tutor, online and offline, with or without a native speaker. The key is to find the most efficient format you can afford.
In a group or individually. Group lessons are suitable if the language level is below B2 and there are no urgent goals. For example, English is needed for career growth and you want to be fluent in it only after a couple of years.
/working-with-repetitor/
6 things to remember when working with an English tutor
But if you have to speak at an English-speaking conference in three months, choose private lessons. They are also effective when your level is B2 or higher. There you will practice only those skills that you need.
Individual lessons are also suitable for those who need a flexible schedule. If you cannot study according to the schedule, the group will not reschedule the lessons for you, but the individual teacher will be able to.
Progress in a group depends on how many people are there. In my opinion, 4-5 people is excellent, 6-8 is normal, and more than 8 is bad. In large groups, not everyone has time to speak in class, and the teacher checks assignments hastily.
But the more people in the group, the cheaper. At work, I researched the market and I believe that for Yekaterinburg the optimal cost of group training is 5000-5500 R per month. Provided that classes are held twice a week for an hour and a half, and in a group no more than 8 people. And the course should have a well-thought-out program and a good teacher.
Any individual lessons are more expensive than group lessons. For example, now, in 2021, at the Global Ambassador school in Yekaterinburg, a group lesson costs 680 R, and an individual lesson costs 1800 R. And at the BKC-IH Moscow school, they will cost 1250 and 4200 R, respectively. Therefore, sometimes group classes are a compromise for those who cannot pay for individual ones. So it was with me.
At a language school or with a tutor. It seems to me that the advantage of the school is that it gives guarantees: if you do not like the classes, you can return the money for them. And they will be taught according to a proven standard program, which can be found in advance. And a tutor without recommendations or reviews is like a cat in a poke: it is not known how he will turn out and whether he is worth his money.
Good schools have entire methodological departments. They design courses, adapt learning materials, and monitor student performance to improve the course. And tutors are guided by their own instinct. Schools also offer additional perks: discussion clubs and apps. The tutor will not offer this.
I don't know how it is written in the contract, but Studywork Moscow school guarantees that after the course you will definitely move to the next level. And if not, then you can study for freeBut, in my experience, studying with a tutor is cheaper than at school. After all, he does not pay methodologists and marketers and does not rent a room. True, specialists with poor qualifications ask very little. And there are also unreasonably expensive schools that raise prices to make a beautiful renovation, a cool website, or invest more money in advertising. Although they study there according to ordinary school textbooks, but students teach.
Ekaterinburg tutors charge 500-1200 R for an hour and a half for Profi-ru, that is, an average of 850 R. I already know that the same lesson in a good school should cost one and a half to two times more. If an hour and a half is cheaper than 1200 R, then the school teacher probably has no experience or is not very good. And if a tutor asks for more than 1200 R for such a lesson, then he obviously overcharges.
Online or live. Online classes are not much different from offline ones. The only difference is that online you don’t have to go anywhere and suffer from a stuffy room. But more discipline is needed: in the classroom there is no temptation to be distracted by the phone, cats or children will not interfere.
Good online schools take this into account. They select emotional teachers, diversify the program and try to keep students' attention. There is also no need to buy textbooks there, all tasks are interactive, and the materials are collected in one place.
/no-bullshit-english-school/
How to tell a good English school from a bad one
So if you need distance learning, it's better to choose online schools rather than traditional ones. Many of the usual ones have also adapted to the remote format, but not at that level. It's the same with tutors: some study online the old fashioned way - using video calls, but without interactive tools.
Remote lessons with tutors cost the same as in person. And in schools, online classes are usually cheaper than in-class lessons. However, keep in mind that online lessons are always shorter: not 90 minutes, and 50-60.
At Inglex online school, a 45-minute lesson with a Russian-speaking teacher costs 650 RUR, 50 minutes at EnglishDom — 990 RUR. But there are more expensive online schools: at Skyeng, 50 minutes will cost 1340 RUR. comparison: one hour and a half offline lesson at the Oxford Center school in Yekaterinburg costs 1,500 RUR. In Moscow, the difference is even greater: at Language Link school, the same lesson in the classroom will cost 3,744 RUR, and at BKC-IH — 4,200 RUR.
Some online schools only offer private lessons, while others offer group options. So you can choose the desired format both online and in person.
In American Club and Education, the cost of online and offline lessons does not differ much. A month of online lessons costs 11,400 or 12,300 R A in a class on weekday evenings - 12,900 or 14,100 R. On weekday mornings and afternoons or on weekends - cheaper With a native speaker or with a Russian-speaking teacher. A native speaker is needed for those whose level is higher than B2: they need more language practice. It will also teach you to understand a specific accent.
But there is a catch with native speakers: schools often call all foreigners that way. Although in reality a native speaker is someone who grew up and lived in a country where English is the official language. Also, knowing a language does not guarantee that a person will teach it well. This requires pedagogical skills. So, if you are going to study with a native speaker, find out what country he is from and study his resume.
And keep in mind: classes with native speakers are 2-2.5 times more expensive. In Skyeng, a lesson with a native speaker costs 2695 R, and with a Russian-speaking teacher - 1340 R. And in Inglex they cost 1700 and 650 R, respectively.
When you choose a format, the main criterion is efficiency. Even if you want to save money, the quality of classes should not suffer from this. If you can’t afford lessons at all, but you want to learn English, you can find a job that offers discounts on tuition or free classes. That's how it happened to me too.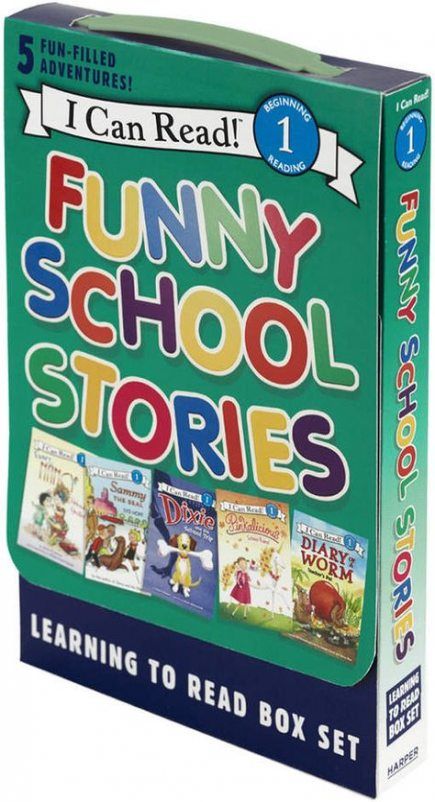
Step 3
Find the right teacherThere is no universal, ideal teacher. Some students ask for a strict teacher, others ask for an older woman, and for some it is important that she be married.
I believe that such criteria only prevent you from finding a suitable teacher - one whose qualifications will suit you and in whose classes you will feel comfortable.
Qualification can be assessed in advance: ask if the teacher has international certificates. They are of two types: CELTA, TEFL and TESOL confirm that the teacher is able to teach English, and TOEFL, IELTS, CAE, CPE - that he knows the language. It is better if there is a certificate of the first type.
/english-exam/
How much does it cost to take IELTS or TOEFL
If the teacher shows a language certificate, check what level it is. If you have A1, A2 or B1, then the teacher must have at least B2. And if your level is B2, choose teachers with C1 or C2.
The level in the certificate is not always indicated according to the CEFR system. This IELTS certificate only has scores for Reading, Listening, Writing and Speaking English. Their values can be checked on the IELTS website. Source: Profi-ruIf there is no certificate, this does not mean that the teacher is bad, but it will only be possible to assess his level in class. For example, I noticed a meager vocabulary of my school teacher. She kept saying "It's interesting" and "Yes, I see", so we didn't learn new words from her.
And my other teacher did not like to answer additional questions. He was confused and in a hurry to move on to a new topic. Most likely, he himself did not understand much.
Who do you feel comfortable with, can only be learned in class. If you are energetic, then a teacher who teaches slowly and methodically is not suitable for you. You will lose interest and quit English again.
A competent teacher will be interested in your goals and hobbies, understand your world and be able to motivate you. He will also tailor the classes for you. For example, recreate communication situations that you will encounter after moving or at work. As a result, you will also receive applied knowledge.
/find-repetitor/
How to find a good tutor
This happened to two of my teachers at a language school. At first I recognized them as colleagues, we communicated well. They were my age, and we had common values. Then the lessons with them were fun, I liked how they motivate me.
The teachers praised me for the assignments that I did well, but they carefully analyzed the mistakes and tactfully made comments if I missed a lesson.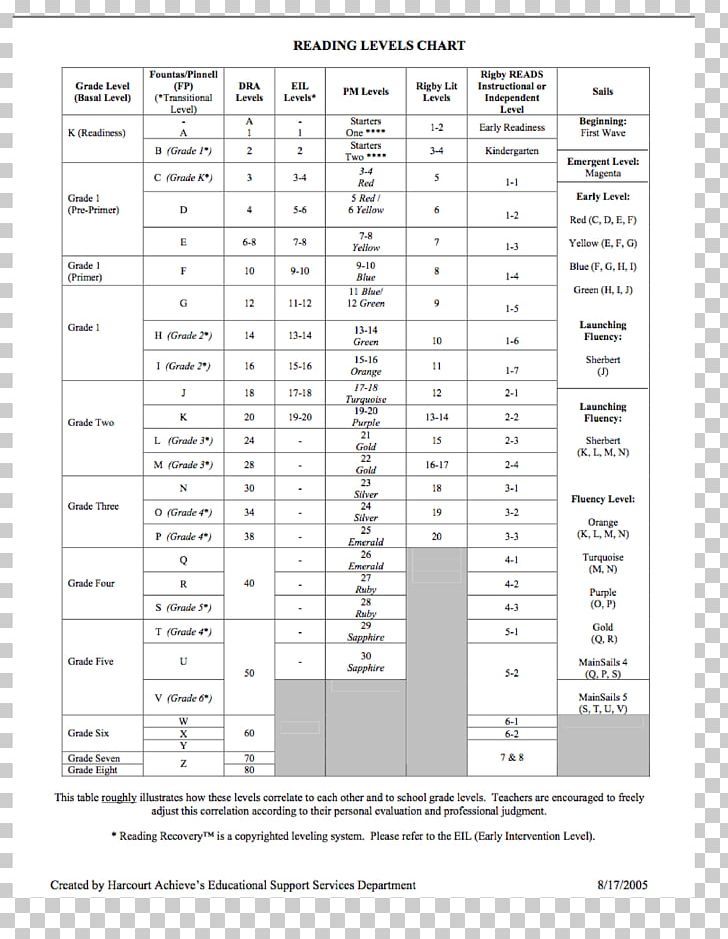 All this gave me confidence and a sense of responsibility. And even when it was difficult, I did not quit, but went to the teachers for help.
Step 4
Set a clear goalThink about why you need English: both the tutor and the administrator at the language school will definitely ask about this. “Just for myself,” “for work,” and “for travel” are not answers. It is better to use the SMART technique: set a specific, measurable, achievable, realistic and time-bound goal.
How to set a goal when learning English
| ❌ No | ✔️ Yes |
|---|---|
| Just for myself | Pass the Cambridge C1 test in May |
| For work | After three months, prepare a commercial offer in English without the help of colleagues |
| Travel | Go on vacation in the spring and order dinner there without Google Translate |
❌ No
✔️ Yes
Just for myself
Take the Cambridge C1 test in May
For work
In three months, prepare a commercial proposal in English without the help of colleagues
you choose individual lessons, the teacher will check your knowledge and help you set deadlines. Doing it yourself is pointless: the goal may turn out to be unattainable, you will be disappointed and abandon English again.
If you study in a group, the teacher will also help with the deadlines. Stay after one of the first classes, talk about your goal and ask when you can achieve it with your level.
I wanted to improve my English in order to write letters faster and not blush in the company of foreign colleagues. My first goal was to prepare for the TOEFL exam in six weeks and pass the mock test. The teacher advised me to aim for 72 points out of 120, but in the end I got 78. It was level B2.
After that, I aimed at C1. With him, I would comfortably cope with work tasks, better understand English-language articles, courses and materials. I went to a group general English course. The goal was to improve the level in a year and confirm this with a test. And I succeeded.
/language-tricks/
“I suddenly jumped to Intermediate”: 9 inexpensive ways to learn a foreign language
But beware: some schools and tutors promise unattainable results. In my experience, the average person is able to master one level per year. Provided that he will practice twice a week without long breaks.
Step 5
Determine the number of classesStandard group courses usually take two times a week, while intensive courses take three.
The teacher will tell you the number of individual lessons. It depends on the goal, the level of your discipline and how quickly you learn the material. Usually this is also twice a week. But if you have an A2 level and in three months you have to work at an international exhibition, you will have to study every day.
If the level is higher than B2, and the goal is to improve some skill, then you can save. Study once a week, and study on your own the rest of the time. In my experience, it's better to set aside 15 minutes every day than to study for three hours once a week.
The main thing is not to miss classes and not to take long breaks, otherwise there will be no progress.
Step 6
Learn about the methodologyI have already mentioned that there are many teaching methods. Here are the most popular ones.
Communicative. Now it is most often used in schools. It develops oral speech and helps to apply a foreign language in different life situations.
Design. It complements the communicative one: students do individual or group projects on real life tasks. And then they present them.
Metacognitive. You independently plan training, set goals and control results. And the teacher just helps.
Grammar and translation. On it you just translate texts and do exercises. The technique is outdated, but still often used.
You may simply not like the technique or may not suit your goals. For example, a friend of mine recently took a tutor to prepare for a trip. The tutor drove him for a month according to the grammar-translation method, although the conversational skill is more needed on the trip.
/list/english-online/
Where to learn English: 24 verified online resources
Ask your tutor or school what method you will use and read about it. If you have already tried this one and did not achieve a result, it is better to try another one. And good tutors and schools often combine several methods: in my school, the general course was communicative and project-based, and when preparing for exams, it was metacognitive.
Once we studied and discussed the topic of corporate social responsibility. Then everyone chose a real company, studied its activities in this area and made a presentation. Moreover, he acted as a representative of this company. In the presentation, it was necessary to use new words and grammatical structures, speak not from a piece of paper and follow intonation. This is an example of a project-based learning methodology.
There are other approaches: direct emphasis is placed on oral speech, lexical approach focuses on learning new words, and audiolingual approach requires constant repetition of standard phrases and constructions after the teacher.
A competent teacher knows several methods and will help you choose the right one.
This is me presenting my project about the Netherlands. This is how we studied the topic of the modern urban environment and quality of life in different countriesStep 7
Learn about the program and textbookProgram and textbook - teacher's tools. A student does not need to understand them deeply, but it is still worth getting to know them. A sound program will help you move towards your goal, and the teacher will track progress.
Program. The tutor must make a plan in the first class. However, if you have a specific goal or large knowledge gaps, then he may not have a to-do list for months ahead. But still, ask what and in what sequence you will study. For example, if your goal is to write well, the program should emphasize this skill. And do not hesitate to ask why you need certain topics.
If you choose group lessons at the school, the course plan will be on the website or in your account. And sometimes the teacher gives out a printout of it. We had a standard scheme in the general course: at the beginning of each month, we were given a table with activities for all eight lessons and homework.
/ielts-in-a-year/
How I improved my English to Advanced level, passed IELTS and moved to Singapore
See if the topics from the plan are close to you and if they are age appropriate. Adults with career goals are better off studying work and business rather than nature and hobbies. Also make sure that according to the plan you will not only broaden your horizons, but also gain skills in English. After all, your task is to master the language.
The program on the site is not always detailed, but you can understand from it what you will study. This one contains not only topics, but also skills - this is important. Source: bkc.ru It is easy to see from the diagram how you will master the language. In courses with universal goals, you need to equally develop writing and speaking, expand your vocabulary and learn to understand English by ear.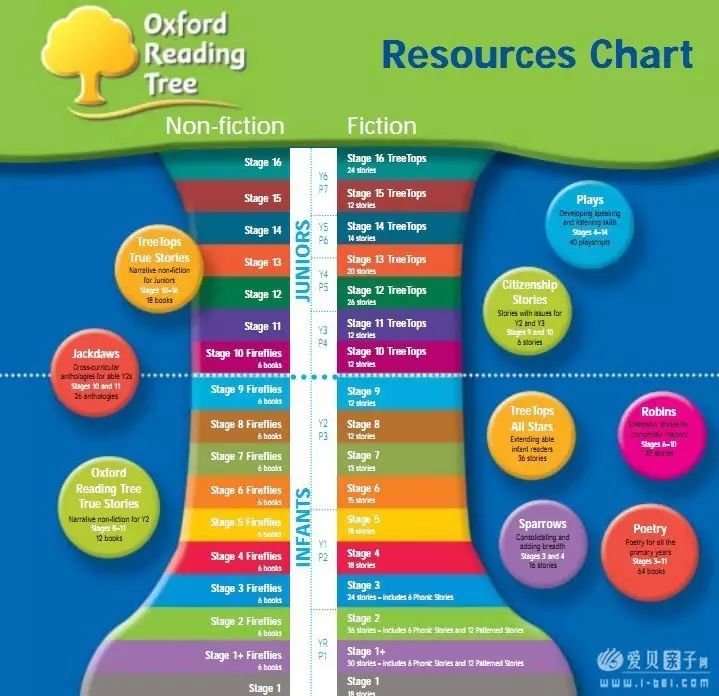 Source: globalambassador.ru
 Textbook. If you will be studying from a textbook, make sure the edition is new enough. The language is changing, and it is not worth studying from books from the last century. It's also great if the textbook is available not only in paper, but also in electronic version. And if there are interesting interactive tasks for it.
In my course there was just such a kit - Navigate from Oxford University Press. I had a paper version, but the teacher in the lesson used the electronic one. She displayed it on the screen, turned on the video, showed the correct answers and entered the words into the exercises right on the interactive whiteboard.
Download the Navigate textbook from Oxford University Press
It also came with a computer simulator, and you could also install an application with tasks on your phone.
A small part of the books that I have left. Basically, these are school and university textbooks, which cost 200-300 R, and classical literature, which I never read. I don't regret buying just two of these books: Longman's Fields of Vision for University and the Navigate Kit for Language School
 Step 8
Find additional materials according to your interestsLearning a language should be fun. Include English in your daily life: watch movies, series and YouTube, read the news. For example, if you are planning to emigrate, find blogs about living abroad, subscribe to expat communities on social networks, and read articles in publications of the desired country.
I have a rule: consume all English-language content only in the original. For example, I watch foreign series in English. In terms of language, I like Bob's Diner: there are a lot of colloquial phrases and puns. And the series "Golyak" helps to practice with accents.
Kinopoisk:
Bob's Diner,
Golyak
Sometimes I listen to podcasts: The Copyblogger for work, Fake Doctors, Real Friends for fun.
But most of all I love to read. At the university, we were asked the classics: Jack London, Somerset Maugham and John Galsworthy.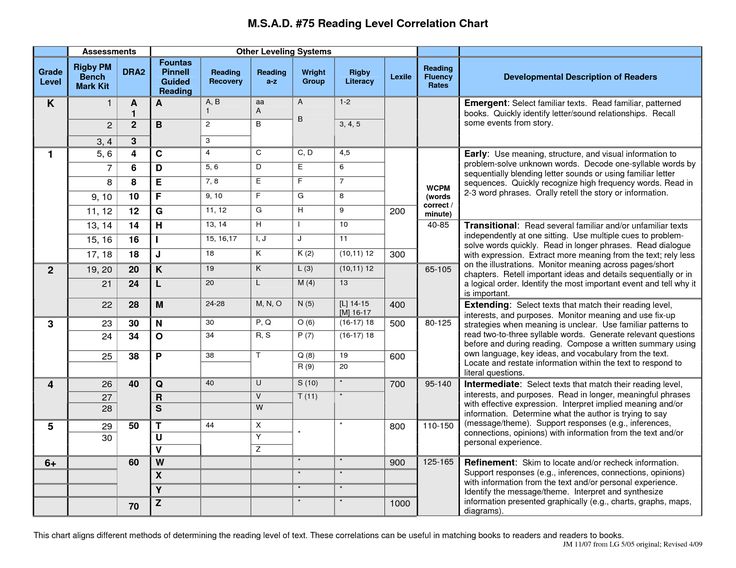 They seemed complicated and boring to me, and for a long time I did not want to read in English.
But then a friend brought me a modern novel with elements of mysticism, and I got sucked in. It was The Shadow of the Wind by Carlos Ruiz Zafon. The author is Spanish, but the novel was translated into English. Since then, I have been reading English fluently. I love Neil Gaiman, non-fiction and some of the classics: Orwell, Bernard Shaw and Oscar Wilde.
But to learn the language, I advise contemporary authors: Donna Tartt, Margaret Atwood, Hanyu Yanagiharu, Julian Barnes, Kazuo Ishiguro, Stephen King. Their books have a living language, and the realities are more understandable. From them you will learn words and constructions that can be used in life. But the replicas of aristocrats from the classics are unlikely to be useful.
Modern literature in English is not cheap: from 800-1000 R per book. But I take them from the Yekaterinburg Belinsky Library. To do this, I signed an agreement in the department of international literature, I pay 500 R per year for a subscription.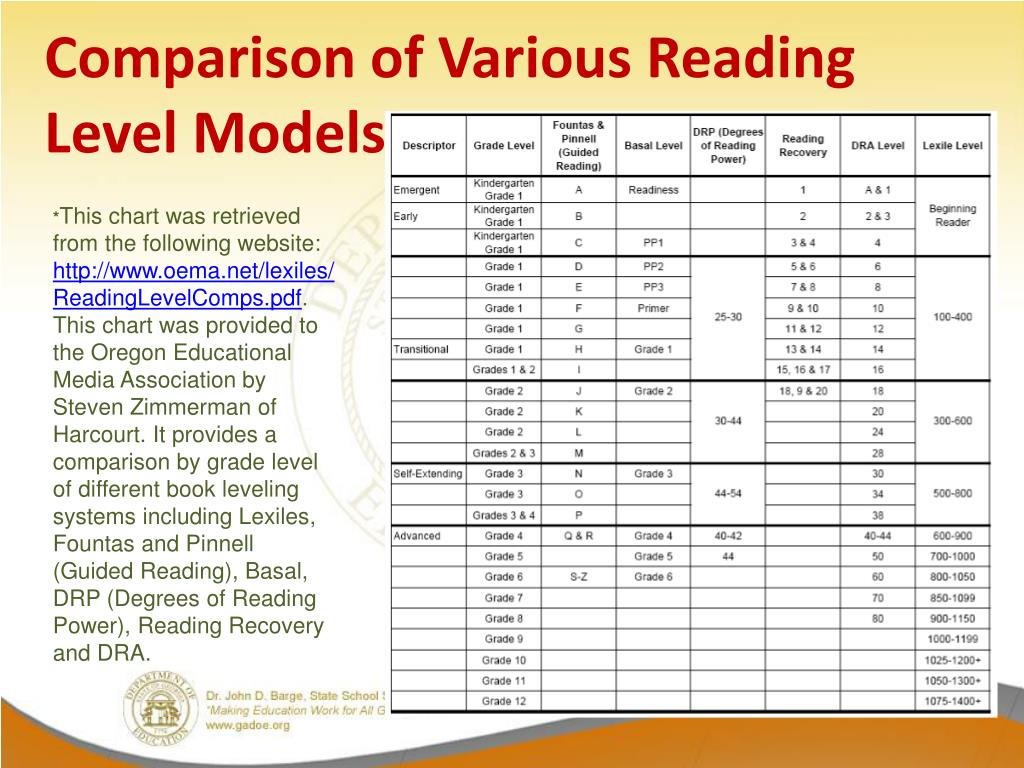
Library website. Belinsky in Yekaterinburg
I took Donna Tartt's "Little Friend" from the library. In "Labyrinth" the book cost 1631 RStep 9
Repeat material and don't skip classesIf you don't go to class regularly and don't do your homework, you won't make progress in English. I was convinced of this when I watched the students of the school. They blamed the teacher, although he had nothing to do with it. But it is much worse that these students doubted their abilities and lost the chance to ever learn English.
Homework. Consolidating knowledge is very important. When you repeat new material, it takes root in your memory.
I like the popular spaced repetition technique. According to it, you need to repeat the words that are written on the cards many times, but constantly increase the intervals between repetitions. To use this technique, just download the application. Quizlet has many ready-made sets of cards for different textbooks. But I used Anki: there you can create personal sets of cards for free.
Download Quizlet:
for iOS,
for Android
Download Anki for browser
Class regularity. In English it is like in training: if you do not practice regularly, the muscles will weaken and you will have to start over. Only instead of muscles, neural connections are involved, which are formed and strengthened in the learning process. They allow you to quickly find the right words and build sentences according to the structures that you have worked out. So that these connections do not fall apart, it is important to develop skills.
Step 10
Check knowledgeTo see progress, you need to regularly check your knowledge. Projects, tests and exams helped me with this.
Projects were intermediate assessments in a language school. At the end of each month, we performed and showed what we had learned during this time. And the teacher gave grades and advised on what else to work on. So, in addition to the long-term goal, I had intermediate ones. They were simple and clear, and I was very happy when I achieved them. This motivated me to move on.
Tests. I have already written about inexpensive tests that will help you check your level. But when you have a mentor, he can offer some of his own. My school used general tests from publishers and separately tested oral and written language.
This is my quick test result from Oxford University Press - they published my textbookExams. Serious international exams are needed only if required by the university or teacher. Each test has its own specifics, and you need to prepare for them for several months. And one exam lasts 3-4 hours. In addition, they are not cheap: in 2021, Cambridge FCE, CAE and CPE will cost 11,000-12,000 R, and TOEFL - 260 $ (19240 R). The price of IELTS varies from 14,000 to 26,000 R and depends on the city.
I needed to pass an international exam in order to work with foreign clients. I chose the Cambridge CAE because the certificate for it is perpetual: according to TOEFL, for example, it is valid for only two years. The exam cost 11,690 R.
If an official certificate is not yet required, but you want to have it just in case, you can take simplified international tests, such as TOEFL Essentials or Linguaskill. They cost $100-120 (7400-8880 R).
/ielts-howto/
How to take IELTS
A test, project or exam will show you if you are making progress and what to look for. After them, you and your teacher will be able to adjust the program, focus on what went wrong, and achieve the goal faster.
Before taking the CAE, I made a promise to myself that I would stop studying if I could get my C1 level. And so it happened. So far, I have enough knowledge to use the language for work: I easily search for specialized materials, read research, sometimes write texts and take English-language courses. The exam had a therapeutic effect: finally, after 18 years, I can say that I am satisfied with my English.
If you want to learn English
- Find out your level in a language school or with the help of online tests.
- Choose the format you can afford. You can study in groups or individually, in a language school or with a tutor, online or offline.
- Find a teacher who knows the language well and who you feel comfortable with.
- Set a clear goal: for example, that after a certain time you plan to take an exam and reach a certain level. Or you are going to defend a project in English. Or you want to write letters on it without hesitation.
- Determine the number of lessons. If you have a high level and no urgent goals, 1-2 classes per week are enough. Otherwise, more may be required.
- Find out about the methodology offered by the school or tutor. It should suit your goals.
- Learn about the textbook and program. The textbook should be modern, and the program should be clear and leading to the goal.
- Read books, watch TV shows and listen to podcasts in English between classes.
- Do your homework and don't miss classes.
- Test your knowledge. To do this, you can write tests, defend projects at your school, or take international exams.
Comparative chart in excel how to do - Computer science ► Computer science at school and at home
Table of contents:
- 1 Comparative chart in excel how to make - We analyze in detail
- 2 How to make a comparative chart in Excel
- 3 Indicators of the level of economic development of the country
- 4 How to insert the recommended chart
- Manual selection of the type 5.1 Types of charts
- 6.
 1 Analyze tab
 - 6.2 Pivot table options 9Video instruction
-
- 9.0.1 Author: Stanislav Salostoi
-
Want to create a site? Find Free WordPress Themes and plugins.
Comparative chart in excel how to do - We analyze in detail
It is very convenient to compare certain indicators in different areas of human life through diagrams. Excel offers a wide variety of views to match any type of data. Let's build comparison charts.
How to make a comparison chart in Excel
The following types of charts can be used to compare different types of data:
- Pie. Allows you to compare the proportions of individual elements in the total value. Such diagrams are not very convenient for comparison.
- Lined. Allows you to compare multiple values in a specific range of data.
- Histograms. Vertical bars for matching values in one or more ranges.
- Graphs. Used to illustrate the trend of the indicator.
 If you need to compare several data series, then several graphs are built in one area.
 - Spot. Show the relationship between two sets of data. Represent points in the construction area.
- Petals. Display the functional dependence of several variables. This type of chart has the form of a curvilinear polygon with several vectors emerging from the center. Vector lines are coordinate axes for each category.
All these examples can be downloaded in one file at the end of the article. The construction of any type of comparative chart begins with the compilation of a table with initial data. General requirements:
- All cells in the original range are filled.
- Rows and columns have labels that Excel automatically generates in the axis labels.
How the program treats data for bar and bar charts and graphs:
- Each row is treated by Excel as a separate data series. In the diagram, this is a single line or bar of the same color.
- Each value in a line is a point on a line chart or a height (length) of a bar.
- Row headers – names of data series (legend).
- Column headings - labels of one of the axes.
How Excel interprets data for pie charts:
- The program only needs one data series (one column of values).
- Each value in a column is a sector of a circle.
- Row headers – sector signatures (legend).
- Column name – name of the data series.
In a scatter plot, the coordinates of each point are values from two datasets. From the first column - the coordinate along the X axis. From the second column - along the Y axis.
Consider the example of how a radar comparison chart is built:
- For comparison, you need the statistical values of several data series. Let's take the GDP growth rate and inflation in Russia for 2005-2015. The indicators are expressed as a percentage.
- Select the entire table, including the column headings.
 On the "Insert" tab in the "Charts" group, select the type "Radar with markers".
 - Data series - GDP growth rate and inflation. That is, there will be two polygons. Categories (horizontal axis labels) – years.
- We get a comparative radar chart with markers.
Changes in GDP and inflation are shown relative to one center.
Indicators of the level of economic development of the country
We use Excel charts to display some comparative indicators of Russia's economic development. The level of economic development is determined mainly by
The leading indicator is GDP.
Let's use a histogram to compare the values of GDP per capita in the USA, Great Britain, Japan, Canada and Russia for the last three years:
Let's analyze the diagram, comparative indicators of economic development and draw all possible conclusions.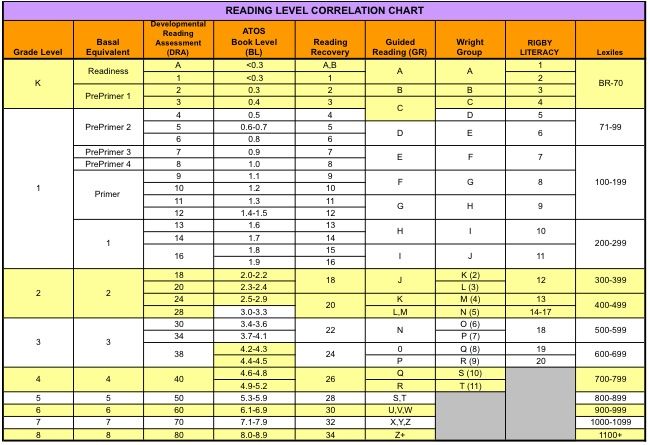 The data for construction are taken from Wikipedia (according to the IMF list). Comparative indicators of the economic development of countries have changed little since the Soviet Union. Here is a chart based on the 1991 values (GDP per capita - figure 1):
Let's compare GNI per capita in the same countries in 2015. Let's use a bar chart:
To illustrate the standard of living of the population, let's take the human development index as the broadest indicator that can be quantified. In addition to economic data, the HDI takes into account life expectancy, literacy and education levels. Let's compare indices by country using a radar chart (data taken for 2014 from Wikipedia):
To compare the share of each industry in the structure of the country's economy, it is better to use pie charts. Russia figures for 2014:
Download example comparative radar chart
Since the share of agriculture and other areas of the primary sector is quite low, secondary and tertiary sectors (manufacturing, services, education) dominate, Russia can be characterized as a developed country.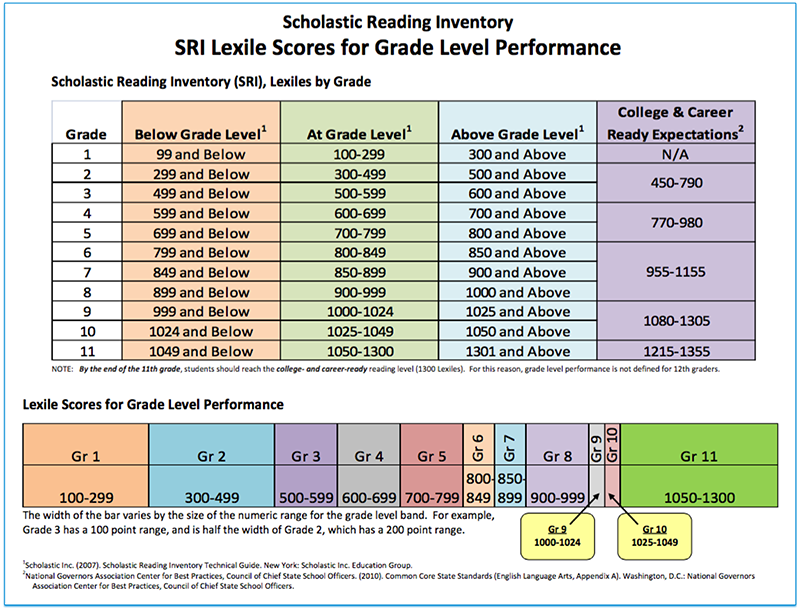 But the human development index is slightly higher than the world average (HDI in 2014 in the Russian Federation - 0.798, in the same 1985 - 0.811).
Excel is one of the best spreadsheet programs. Almost every user has it on their computer, since this editor is needed both for work and for study, while performing various coursework or laboratory tasks. But at the same time, not everyone knows how to make a chart in Excel according to the table data. In this editor, you can use a huge number of templates that have been developed by Microsoft. But if you do not know which type is better to choose, then it would be preferable to use automatic mode.
How to insert a recommended diagram
In order to build such an object, you must perform the following steps.
- Create a table.
- Highlight the information you are going to chart.
- Click the Insert tab. Click on the "Recommended Charts" icon.

- After that, you will see the Insert Chart window. The proposed options will depend on what exactly you select (before clicking on the button). Yours may be different, as it all depends on the information in the table.
- In order to build a chart, select any of them and click OK.
- In this case, the object will look like this.
Manual chart type selection
If you don't like any of the recommended options, you can always choose something from the toolbar. To do this, you need to take the following steps.
- Select the data you need for analysis.
- Then click on any icon from the specified area.
- Immediately after this, a list of different object types will open.
- By clicking on any of them, you will get the desired diagram.

To make it easier to make a choice, just point at any of the thumbnails.
What are the diagrams
There are several main categories:
Note that this type is appropriate when all values add up to 100 percent.
In this case, the point is a kind of marker.
If none of the above suits you, you can use combined options.
How to make a PivotChart
This tool is more complex than those described above. Previously, everything happened automatically. You only had to choose the look and the desired type. Everything is different here. This time you have to do everything manually.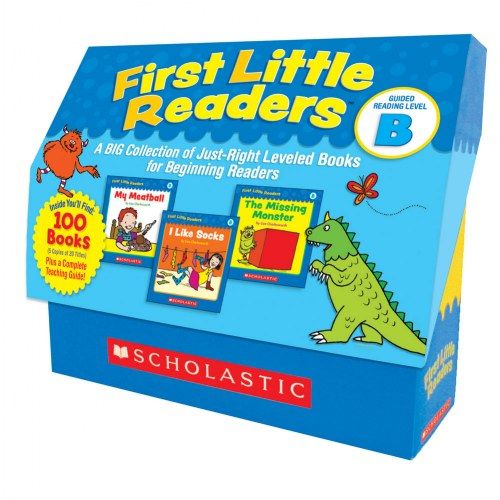
- Select the desired cells in the table and click on the corresponding icon.
- Immediately after this, the Create PivotChart window will appear. You must specify:
- table or range of values;
- the location where the object should be placed (on a new or current sheet).
- Click the OK button to continue.
- This will result in:
- an empty pivot table;
- empty chart;
- PivotChart fields.
- You need to move the desired fields with the mouse to the areas (at your discretion):
- legends;
- axles;
- values.
- In addition, you can configure which value should be displayed. To do this, right-click on each field and click on the item "Settings for value fields ...".
- This will bring up the Value Field Options window. Here you can:
- sign the source with your estate;
- Select the operation to be used to summarize the data in the selected field.
Press the OK button to save.
Analyze tab
After you create a PivotChart, you will have a new Analyze tab. It will immediately disappear if another object becomes active. To return, just click on the chart again.
Let's take a closer look at each section, because with the help of them you can change all the elements beyond recognition.
Pivot Table Options
- Click on the very first icon.
- Select Options.
- This will open the settings window for this object. Here you can set the desired table name and many other parameters.
To save the settings, click on the "OK" button.
How to change the active field
If you click on this icon, you will see that all tools are not active.
In order to be able to change any element, you need to do the following.
- Click on something on your diagram.
- As a result, this field will be highlighted with circles.
- If you click on the "Active field" icon again, you will see that the tools have become active.
- For settings, click on the appropriate field.
- This will display the Field Options window.
- For more settings, click the Layout & Printing tab.
- To save the changes, you must click on the "OK" button.
How to insert a slicer
If desired, you can set the selection to certain values. This feature makes it very convenient to analyze the data. Especially if the table is very large. To use this tool, follow these steps:
- Click the Insert Slice button.
- As a result of this, a window will appear with a list of fields that are in the pivot table.
- Select a field and click OK.
- As a result of this, a small window will appear (it can be moved to any convenient place) with all the unique values (rollup totals) for this table.
- If you click on any row, you will see that all other entries in the table have disappeared. It remains only where the average value corresponds to the selected one.
That is, by default (when all lines are highlighted in blue in the slice window), all values are displayed in the table.
- If you click on another number, the result will immediately change.
- The number of lines can be absolutely anything (at least one).
Both the pivot table and the chart based on its values will change.
- If you want to delete a slice, you need to click on the cross in the upper right corner.
- This will restore the table to its original state.
In order to remove this slicing window, you need to follow a few simple steps:
- Right click on this element.
- After that, a context menu will appear in which you need to select the item "Delete 'field name'".

- The result will be as follows. Please note that in the right part of the editor there is again a panel for setting the fields of the pivot table.
How to insert a timeline
To insert a date slicer, follow these steps.
- Click on the corresponding button.
- In our case, we will see the following error window.
The fact is that for a slice by date, the table must have corresponding values.
The principle of operation is completely identical. It's just that you will filter the output of records not by numbers, but by dates.
How to update the data in the chart
To update the information in the table, click on the corresponding button.
How to change build information
To edit a range of cells in a table, do the following:
- Click on the "Data Source" icon.
- In the menu that appears, select the item of the same name.
- Next, you will be asked to enter the desired cells.
- Click OK to save the changes.
Editing a chart
If you are working with a chart (regardless of whether it is a regular chart or a pivot chart), you will see the Design tab.
There are a lot of tools on this panel. Let's consider each of them more carefully.
Add element
If you wish, you can always add some object that is not present in this chart template. To do this, you need:
- Click on the "Add chart element" icon.
- Select the desired object.
Thanks to this menu you can change your chart and table beyond recognition.
Express layout
If you don't like the default chart template, you can always use other layout options. To do this, just follow these steps.
- Click on the corresponding icon.
- Choose the layout you want.
You don't have to make changes to your object right away.
When hovering over any icon, a preview will be available.
If you find something suitable, just click on this template. The appearance will automatically change.
Chart Styles
To change the color of the elements, follow these steps.
- Click on the corresponding icon.
- As a result, you will see a huge palette of different shades.
- If you want to see how it will look on your diagram, just hover over any of the colors.
- To save changes, click on the selected shade.
In addition, you can use ready-made themes. To do this, you need to do a few simple operations.
- Expand the full list of options for this tool.
- To see how it looks enlarged, just hover over any of the icons.
- To save changes, click on the selected option.
Data
In addition, manipulations with the displayed information are available.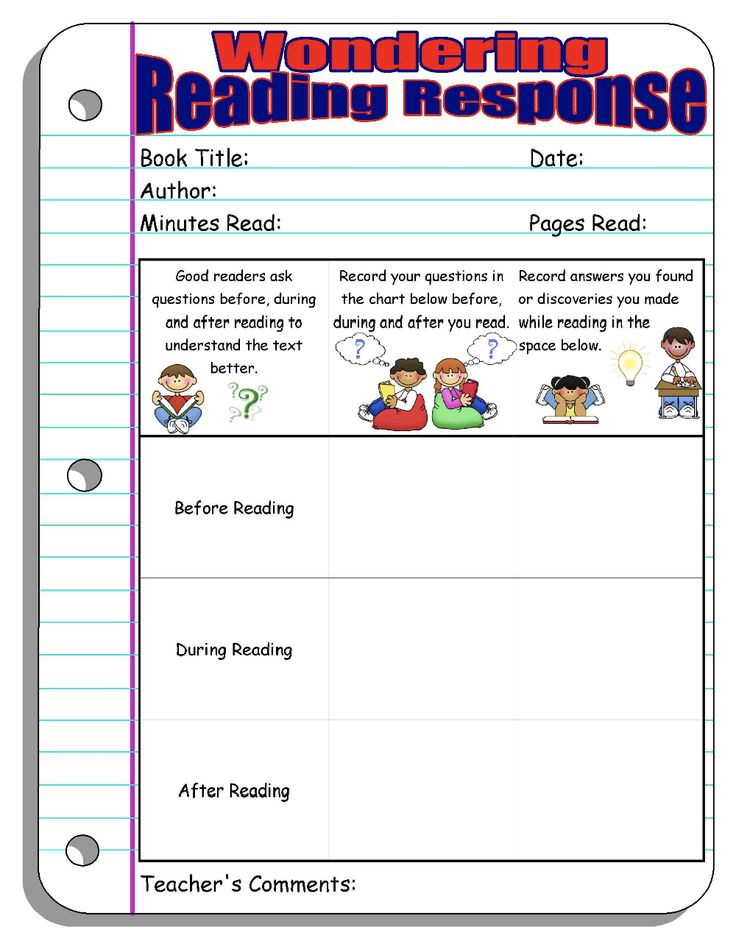 For example, you can swap rows and columns.
After clicking on this button, you will see that the chart looks completely different.
This tool is very helpful if you are unable to correctly specify fields for rows and columns when building this object. If you made a mistake or the result looks ugly, click on this button. Perhaps it will become much better and more informative.
If you press again, everything will return back.
In order to change the range of data in the table for plotting a chart, you need to click on the "Select data" icon. In this window you will be able to
To save the changes, click on the "OK" button.
How to change the chart type
If you are not satisfied with the previously selected chart category, you can change it at any time. To do this, you need:
- Click on the specified icon.
- In the window that appears, select the template you need.
- When you select any of the items on the left side of the screen, options for plotting the chart will appear on the right.
- For easier selection, you can hover over any of the thumbnails. As a result of this, you will see it in an enlarged size.
- To change the type, click on any of the options and save with the OK button.
Conclusion
In this article, we took a step-by-step look at the technology of building charts in the Excel editor. In addition, special attention was paid to the design and editing of the created objects, since it is not enough to be able to use only ready-made options from Microsoft developers. You must learn to change the look to suit your needs and be original.
If something doesn't work for you, you might be highlighting the wrong element. Keep in mind that each shape has its own unique properties. If you were able to modify something, for example, with a circle, then doing the same with the text will not work.
Video instruction
If for some reason nothing comes out, no matter how hard you try, a video has been added below, in which you can find various comments on the actions described above.
Information that is displayed visually is much easier to perceive, this is a proven fact. The trend is especially clear in different comparisons. Below we will look at how to build a chart in Excel from table data. This will be a step-by-step instruction without unnecessary "water" and we will also touch on a number of related issues.
Creating a diagram
We will solve the problem in different ways, but you will choose the most suitable one. So let's get started.
Histogram
This type is suitable when we just need to visually display values, or compare them with others.
- In order to start creating a chart, you first need to have the data that will form the basis of it.
 Therefore, select the entire column of numbers from the plate and press the Ctrl + C button combination.
- Next, click on the Insert tab and select the histogram. It will display our data in the best possible way.
- As a result of the above sequence of actions, a diagram will appear in the body of our document. First of all, you need to adjust its position and size. To do this, there are markers that can be moved.
- We set up the end result as follows:
- Let's give the sign a name. In our case, these are Product prices. To enter edit mode, double-click on the diagram title.
- You can also enter the editing mode by clicking on the button marked with the number 1 and selecting the Axes name function.
- Apparently, the inscription appeared here too.
This is how the result of the work looks like. In our opinion, it is quite good.
Comparison of different values
If you have several values, you can add them here too, so we can get great material for visual comparison.
- Copy the numbers of the second column.
- Now select the diagram itself and press Ctrl+V. This combination will insert the data into the object and force it to be ordered with columns of different heights.
The program has hundreds of other types of graphs, they can be found in the Insert menu. Through trials and combinations, each must be dealt with separately.
Percentage
In order to more clearly understand the role of the various cells of our table and its values in general, we can compare the results in the form of a pie chart. And we will do this with the output of the percentage. Let's get started.
- As in the previous cases, we copy the data of our plate. To do this, just select them and press the key combination Ctrl + C.
 You can also use the context menu.
- Click the Insert tab again and select the pie chart from the list of styles.
- Once the output method is added, you will see the following picture:
- Next, we need to change the style and select a profile with percentage display. This is done after selecting the finished object in the list of styles.
- Well, a completely different result. The chart looks quite professional. We managed to make a truly excellent visual indicator.
All parameters, including colors, fonts and their shadows, are flexibly configured in Microsoft Excel. The abundance of control elements is truly great.
Summary and comments
That's all, now the issue of creating a chart in Excel is fully disclosed. We hope our article was useful to you. If you still have questions, ask them in the comments, help from our side will not be long in coming.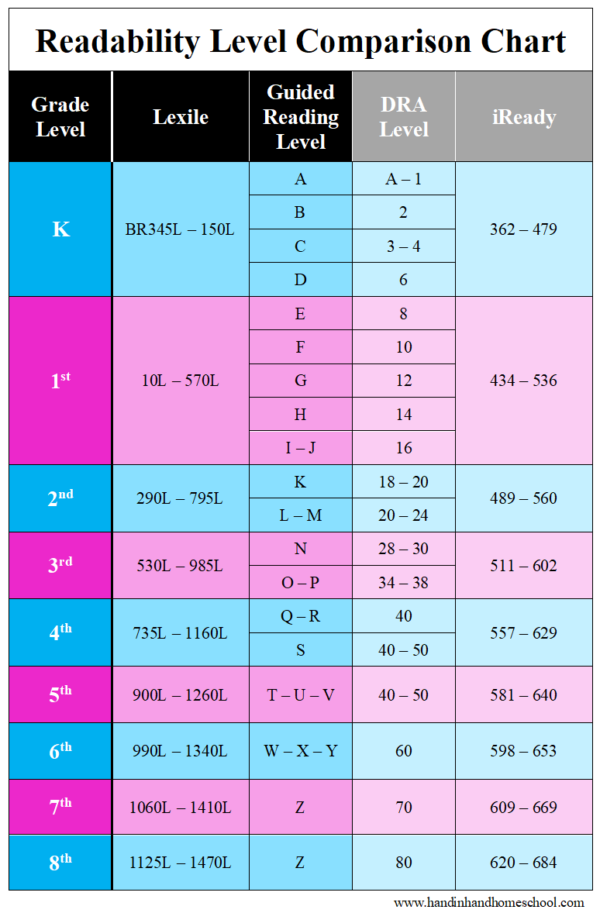
Video
For greater clarity and completeness of the process, we have also recorded a training video. We invite you to familiarize yourself with its content.
How to make a chart in Excel: step by step
5
(100%)
1
Votes
How to compare the growth of two different indicators in Excel? You can "simply" compare the data. True, if they are not comparable, then you will not see much of anything. For example, you can build a histogram with two bars.
Or show data in merged graphs using a secondary axis.
But there is another option, perhaps the most obvious: the method of basic substitution, which The Economist loves. How to do this in Excel, see the instructions.
And now, in order:
- Initial data - the amount of retail sales and sales in the markets for several years.
2008 2009 2010 2011 2012 retail trade turnover 13 853 14 599 16 499 19 083 21 395 sales of goods in the markets 1 837 1 986 2 095 2 385 2 268
 And in the column with the first year (in the table - 2008) we put down 100%.
 In the first column, indicate the names of directions and the amount of sales for the last year: “retail 21.4 trillion rubles”, “markets 2.3 trillion rubles.”
The values of all period columns except the last one are #N/A. The last column contains the percentage of actual growth.
The result is the following table:
- We build a graph: select the source data and click Insert -> Graph.
- Set up the graph:
Select a combo chart and set the chart types as shown.
- Customize chart colors, title and axes display.
 The diagram is ready.
More interesting charts in the article:
Author: Stanislav Salostoi
Excel is an excellent tool from the Microsoft Office software package for creating and working with tabular data of various complexity. In some cases, the tabular presentation of data is not enough to interpret patterns and relationships in numerical arrays. Especially if they contain several tens or even hundreds of lines. In this case, charts come to the rescue, which are very easy and convenient to build in Excel.
How to make a chart in Excel Consider how to create a chart in the modern version of Excel with tabular data already entered.
- Highlight the tabular information you want to express in the chart, starting with the top left cell and ending with the bottom right. This data will be used to build the chart.
initial values for plotting a chart
- In the main menu, activate the "Insert" tab and select the desired type of chart in the "Charts" group.
selecting the "Charts" group from the "Insert" tab
- In the menu that opens, select the type of chart you need, based on its functional purpose.
- In a bar chart, data categories are typically placed on the horizontal axis and values are placed on the vertical axis. In 3D bar charts, data categories are shown along the horizontal and depth axes, while the vertical axis displays the value of the data.
- Graphs that show how data changes over time have data categories on the horizontal axis and values on the vertical axis.
- Pie charts - display only one series of data, therefore they are formed according to the simplest principle: the share of each sector in the circle depends on the share of the value of each data group from the total value.
- In bar charts, data categories are arranged along the vertical axis, their magnitudes along the horizontal axis.
- Scatter charts do not initially differ in the types of information that is located on their vertical and horizontal axes.
 When showing relationships between the numerical values of the data series, they omit differences in the axes. If desired, they can be changed, and the diagram will not lose its information content.
 - Stock charts are the most complex type of charts based on the principle of building information. When building stock charts, relationships, ratios and patterns of changes in several values at once are taken into account.
- Bubble charts are used when you want to display data from a spreadsheet. It uses two columns that distribute values along the X and Y axes, and the size of the bubbles depends on the numeric values in adjacent columns.
- After selecting the general type of chart, you will be prompted to select one of the subtypes of charts, depending on the required visual design. Make your choice.
chart type selection
- The chart that the program has built based on your data will appear in the center of the Excel sheet.
summary chart
- Most likely it will differ from what you need due to incorrect selection of data series and values by the program.
 You need to refine the presentation of information on the diagram. To do this, click the "Select Data" button.
 - In the window that appears, select indicators in accordance with your tasks and click the OK button to save the changes.
Editing the design of the diagram You can always change the appearance of the default diagram, change its format and add the necessary captions. To do this, click on the diagram, after which an area highlighted in green will appear on top. It will contain three items: "Constructor", "Layout", "Format".